Transcripción completa del PDF reformateada para lectura web. Descargar PDF original para tablas, figuras y referencias.
Ó Copyright 2019 Hausmann, Ricardo; O’Brien, Tim; Santos, Miguel Angel; Grisanti, Ana; Kasoolu, Semiray; Taniparti, Nikita; Tapia, Jorge; Villasmil, Ricardo and the President and Fellows of Harvard College

In the decade prior to the global financial crisis of 2008-2009, Jordan enjoyed a period of impressive macroeconomic performance. The prolonged expansion was export-led, with total exports of goods and services tripling over that period. The boom was not only due to better prices for Jordan’s exports, as there were also significant gains in global market share of Jordan’s garment, agriculture and chemical exports. Throughout these years, the country ran large current account deficits that were largely financed by massive inflows of foreign direct investment (FDI) coming from the United Arab Emirates, United States, India, Bahrain and Saudi Arabia. By 2009, the size of total public debt was moderate, at 55% of the size of the economy.
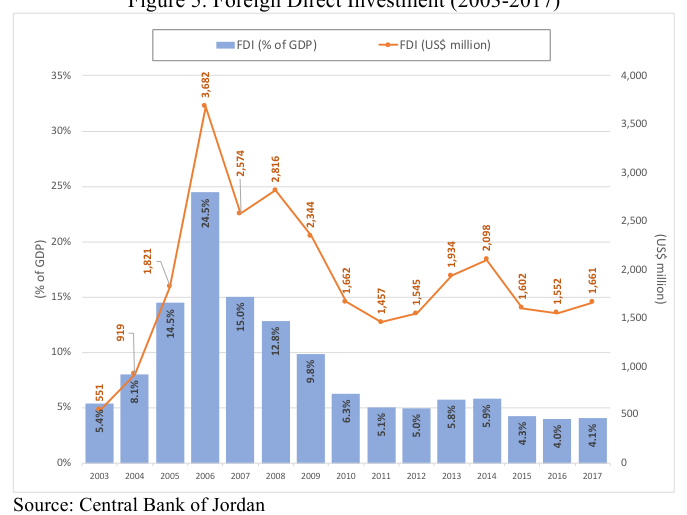
The Global Financial Crisis of 2008-2009 and a series of subsequent negative external shocks affected Jordan in significant ways, throwing its economy out of balance. Conflict in neighboring countries led to reduced demand from key export markets and cut off important trade routes. FDI, which averaged 12.7% of gross domestic product (GDP) over the period 2003-2009, fell to 5.1% of GDP over the period of 2010-2017. At the same time, they brought a massive wave of migrants and refugees, resulting in a net population increase of 50.4% between 2008 and 2017. The region’s instability also brought severe negative impacts to the cost of energy. The supply of oil from Iraq in concessional terms came to an end in 2004, and the Egyptian natural gas pipeline suffered numerous disruptions in 2011, forcing Jordan to import expensive liquid fuels at a time of record prices, furthering pressures on its balance of payment and its fiscal accounts. That had a negative impact on Jordanian manufactures, which tended to be electricity-intensive.
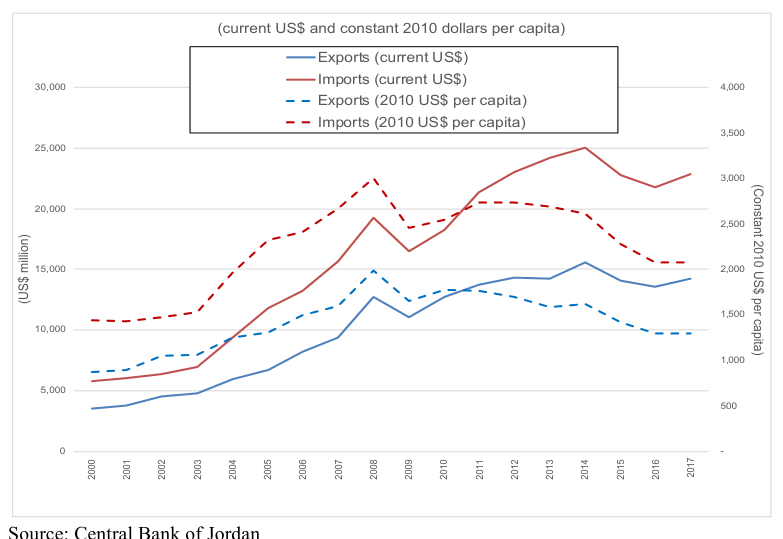
Export growth initially only decelerated between 2009 and 2013 as global trade slowed down and Jordan’s market share gains in garment and chemical exports stagnated. Then, between 2014 and 2016, exports plummeted by 13% as trade with and through Iraq and Syria collapsed. The downturn was particularly sharp in agriculture, transport and tourism. As a consequence of these external shocks, imports fell along with exports – by 2017 they were 20% down from 2014 in real terms per capita, 44% below their 2008 peak.
The deceleration of export-led growth and the dramatic fall in imports had an important negative impact on tax revenues. To confront this situation, the country implemented a massive reduction in its fiscal impulse – domestic spending net of domestic revenue – of 8.1% between 2011-2017. 1 This adjustment was accomplished by increasing indirect taxes, eliminating subsidies, and cutting public investment. The six-year adjustment is significantly larger than those registered in Spain (4.6% of GDP, 2009-2015) and Portugal (6.1%, 2010-2016) in a comparable period of time, and not far below the one recorded in Greece (10.7%, 2010-2016).
Amidst such a large fiscal consolidation, the economy has displayed extraordinary resilience, growing at an average rate of 2.5% over 2011-2017. However, because of the extraordinary rate of population increase, this translated into a significant contraction of per capita income – by 12% over the period 2010-2017. Unemployment has risen to 18.7%, and is particularly high among women (28.1%) and youth (39.7%).
In spite of the massive fiscal adjustment, Jordan’s debt-to-GDP ratio rose from 70.7% in 2011 to 95.5% in 2017. The fact that Jordan was forced to issue debt in Eurobond markets at increasing yields at a time when its economy was not fully stabilized suggests that the 2012 and 2015 International Monetary Fund (IMF) programs were underfunded. Continuing along this path risks causing a rising debt service burden that would make fiscal stabilization even more challenging. In order to allow the country room to implement its growth strategy, the Jordanian government needs to make sure that it will be able to finance its declining deficit and roll over its maturing debt without having to return to the Eurobond market until the economy is fully stabilized.
Given the fiscal restrictions, growth can neither depend on a fiscal stimulus, nor can it be expected to follow from fiscal discipline. At the same time, the fact that the current account deficit is already large means that growth cannot be led by increases in domestic private demand for nontradable goods, as these will require more imports that would worsen the external balance. Thus, Jordan’s growth strategy must be driven by exports and investment that either directly or indirectly supports export growth. Resuming export growth will have a multiplier effect on the non-tradable sector, which has been negatively impacted by the drastic cut in domestic spending.
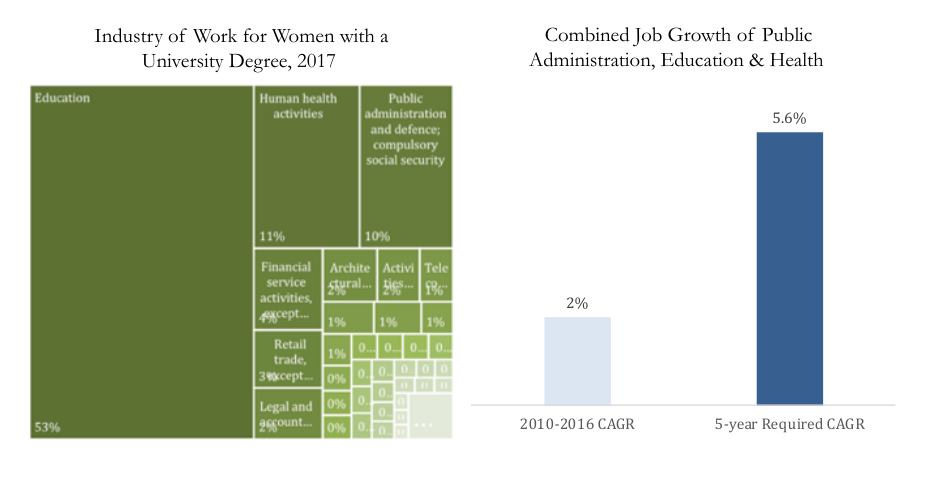
There are some significant differences between today and the conditions prevailing over the long growth acceleration of 2000-2008. Although the most noticeable change to Jordan’s labor market since 2008 has been the inflow of refugees, it is a longer-term development that defines the country’s biggest advantage: its highly educated Jordanian workforce. What is most striking is the long-term increase of highly educated women. Female tertiary enrollment rate has increased by 30 percentage points in two decades, from 20% in 1995 to almost 50% in 2015. Although the rate has plateaued for several years, this still means that every year the Jordanian labor force becomes more skilled as the working age population with a college education converges to this rate. Traditionally, public administration, education and the health sector have been the largest employment of female labor, but given fiscal restrictions it is unlikely that they can grow enough to absorb the large increase expected in qualified female labor. Thus, Jordan needs to create jobs in other tradable goods and services that tend to absorb Jordanian women and pay higher wages, such as telecommunications, information technology, or – more broadly – business services.
Secondly, energy costs in Jordan have risen substantially, as the system has adjusted to maintain stability of supply in the face of more expensive energy inputs. Meanwhile, water
scarcity, which has long been a disadvantage for Jordan as an input to production, has intensified in recent years as a result of more expensive electricity (used in the filtering and transportation of water) and the demands of a larger population. Thus, in the short term, Jordan needs to pursue a strategy led by sectors that are not intensive in energy or water. At the same time – in order to drastically expand comparative advantage over time – Jordan must pursue a multi-pronged strategy to reduce the cost of electricity. The energy strategy must exploit Jordan’s natural advantages for renewable generation and leverage on new technologies to maintain grid stability. This transition will have direct positive benefits on the balance of payments and will open new opportunities for sustainably increasing water supply.
Given these factors, it should come as no surprise that service exports grew much more steadily than goods exports since 2008. Jordan’s service exports grew steadily – with a minor hiccup after the financial crisis – from US $1.6 billion in 2000 to US $7.1 billion in 2014. Travel, tourism, transportation and logistics delivered the bulk of this growth, but regional instability caused these sectors to stagnate from 2014 onwards. At the same time, Jordan has increasingly emerged as a hub for activities related to information, communications and technology (ICT). ICT, along with business services and electricity, is exceptional in that it has seen an increase in FDI into Jordan since 2008 in the midst of the overall slowdown.
The Center for International Development at Harvard University (CID) developed a tool to perform economic complexity analysis inclusive of services for the first time, and applied this tool to Jordan. Using this tool to understand existing and latent areas of comparative advantage that can be developed with relative ease by redeploying the knowhow, skills and capacities that the country already has, we have identified eight export themes that have the highest potential to drive growth in Jordan while supporting increasing wage levels and delivering positive spillovers to the non-tradable economy: 1) Business, IT and professional services, 2) Education services, 3) Healthcare services, 4) Creative industries, 5) Tourism, 6) Transportation and logistics, 7) Construction materials and services, and 8) agriculture and food processing.
The results of this analysis confirmed previous qualitative assessments by identifying a strong orientation toward high-skill, tradable services among Jordan’s most strategic sectors. Crosschecking these themes in Jordan’s economic census and survey data shows that the first four tend to support higher wage levels, require higher levels of education, and employ higher rates of women than the rest of the Jordanian economy, which also matches patterns from more mature economies. Overall, Jordan will tend to compete with richer countries in several of these highskill, tradable services in order to serve regional and global markets, but Jordan’s unusually high human capital for its level of income provides a strong cost advantage to companies that need a place to perform relatively labor-intensive tasks. The final four themes include a mix of low and high-skill labor requirements while drawing Jordan’s unique advantages in its location and climate. Strong growth in these sectors can support new jobs for Jordanians and non-Jordanians alike.
These strategic export themes represent a mix of specific industries in which Jordan already has a relatively large presence and industries that are incipient, but where global patterns suggest that Jordan has latent capabilities. Jordan’s abilities to achieve sustainable and inclusive exportled growth will depend on maximizing the potential of both types, accelerating growth in existing industries (the intensive margin) and attracting new business models that build on Jordan’s existing knowhow and capabilities (the extensive margin). For the intensive margin, it is critical for the government to work jointly with the private sector to understand, and iteratively solve, sectorspecific constraints to higher productivity and better market access. For the extensive margin, the Government of Jordan as well as donor nations can play a role in promoting foreign direct investment to jumpstart these sectors.
One critical constraint to the growth of existing high-skill service exports that emerges from interviews with existing companies and has been confirmed through econometric analysis is existing restrictions (and high transaction costs) on hiring high-skill workers from abroad that provide the necessary complements to high-skill Jordanian workers. Often, in order to operate, a company needs access to a few individuals with very specific types of experience that are not available in Jordan. This is a normal and necessary part of innovation, but Jordanian regulations restrict the hiring of high-skill foreigners in an attempt to protect Jordanian jobs. This is a problem that is actually costing untold job opportunities for Jordan’s best and brightest and keeping Jordan’s most promising tradable industries small. The Government of Jordan is now working to address this issue.
As the government focuses resources on unleashing the competitiveness of these strategic export themes, it must work in close coordination with the private sector to identify other critical constraints to the growth of these sectors and collaborate to address them.
On the extensive margin, the most powerful tool for growth is active and strategic investment promotion. We have analyzed foreign investment flows across the themes and found that in any given year, there are hundreds of companies, tens of thousands of jobs, and hundreds of millions of dollars of foreign investment across the export themes flowing to the region, and the UAE in particular, across the identified themes. If Jordan were to attract just a small share of these investment flows, it would significantly boost the development of these activities. The Government of Jordan can increasingly focus its efforts on actively communicating with targeted companies to provide specific messages on why they can thrive in Jordan and where in the country they can find the land, infrastructure, and human resources that they need.
Beyond these sector-specific interventions focused on activating stronger growth on the intensive and extensive margin of the private sector, Jordan must improve its ability to deliver targeted infrastructure investments, among other public goods and services, which will improve productivity across the board and expand its comparative advantage.
In sum, the growth strategy must be cognizant of the fiscal and balance of payments constraints that the country faces. As a consequence, it shall be export-led and leverage on the growth of these activities to generate multiplier effects on the rest of the economy. The strategy must acknowledge the worsened competitiveness in electricity and water – by promoting high-potential sectors that are not intensive in neither of these – but shall also consider that new technologies in solar and wind can leverage the country’s natural advantages in these areas to lower energy prices. The strategy must consider the rising share of high-skilled female citizens that are joining the labor force, and the fact that within a fiscal consolidation environment the industries that at present employ the bulk high-skilled female labor – education, health and the civil service – are unlikely to expand enough in order to employ the increased supply. As a consequence, it proposes to promote export services that are more intensive in high-skilled female labor.
The export-led growth strategy must recognize that key infrastructure investments will be needed that should ideally involve private sector investment. However, it is aware of the fact that project preparation efforts and a dearth of patient and more equity-like capital to invest in these projects. While all these changes are implemented, it is important to make sure that the government is able to fund itself at low interest rates in order to avoid an increase in debt service costs while the program is carried out.
1. Jordan’s growth trajectory
In the decade prior to the global financial crisis of 2008-2009, Jordan enjoyed a period of impressive macroeconomic performance. Gross domestic product (GDP) grew at an average of 6.5% per year – 3.4% in per capita terms – a total cumulative increase in per capita income of 38.0% between 1999 and 2009. This steep trend came to an end by 2008, a point that reveals the strongest structural break in Jordan’s growth data since 1975 (Figure 1). 2 From then onwards, the financial crisis and a series of negative external shocks – including the Arab Spring and the Syrian refugee crisis – slowed down growth to a yearly 2.5% over the following nine years (2009-2018).
Figure 1. (Ln) GDP per capita
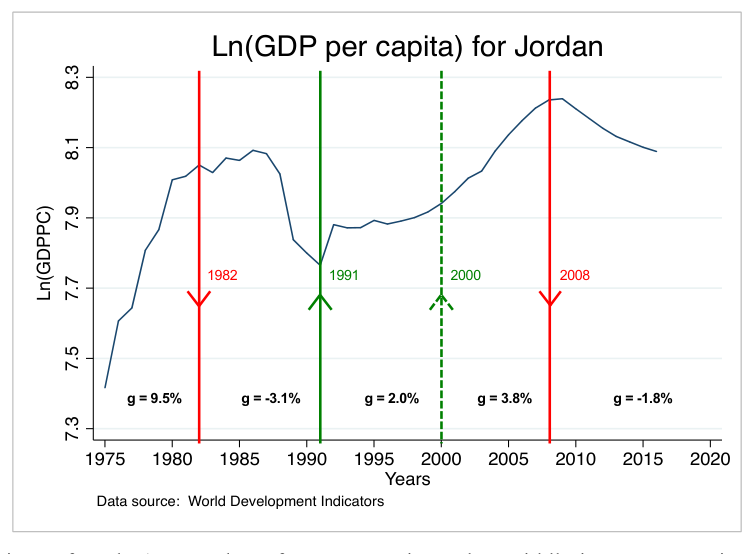
A comparison of Jordan’s growth performance against other middle-income countries of the Middle East and North African (MENA) region reveals that the country’s economic boom was larger than elsewhere prior to the structural break (2008) , whereas the ensuing deceleration was relatively similar to its counterparts’ . 3 However, when viewed in per capita terms, as illustrated in Figure 2, Jordan’s (and to a lesser extent, Lebanon’s) contraction grossly outpaces the region’s, due to the massive influx of refugees driven by the Arab Spring (2011) and the Syrian
refugee crisis (2014). According to World Bank figures 4 – Jordan’s population grew from 6.5 million in 2008 to 9.9 million at the close of 2018. Failure to cope with a 52.6% increase in population between 2008 and 2018 – a trend that was particularly exacerbated after 2014 by the Syrian refugee crisis – has caused Jordan to register nine consecutive years of negative growth rates in GDP per capita, resulting in a cumulative loss of 14.0% over the past decade .
Figure 2. GDP Growth and GDP per capita (selected countries)
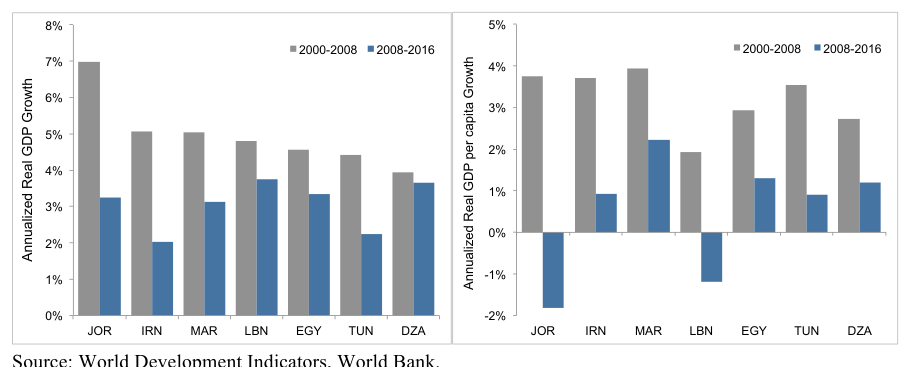
Source: World Development Indicators, World Bank.
The contribution to growth of different sectors (Figure 3) registered substantial differences between the economic boom and the deceleration period. In the former (2000-2008) growth was driven by a significant increase in manufacturing (1.74 percentage points or pp.); finance, insurance and real estate (1.54 pp); and transportation, storage and communications (1.00 pp). Together, these three sectors accounted for two-thirds of the average annual growth (6.9%) recorded between 2000-2008. From then onwards , within the context of a significant deceleration (compounded annual growth rate of 2.8% between 2008 and 2017), the contribution of the manufacturing sector fell to one-sixth of what it had been in the previous decade (0.3 pp), while the service sector —including financial, real estate and insurance (0.79 pp.); transport, storage and communications (0.49 pp.), and wholesale and retail (0.26 pp.)— took the lead in driving growth .
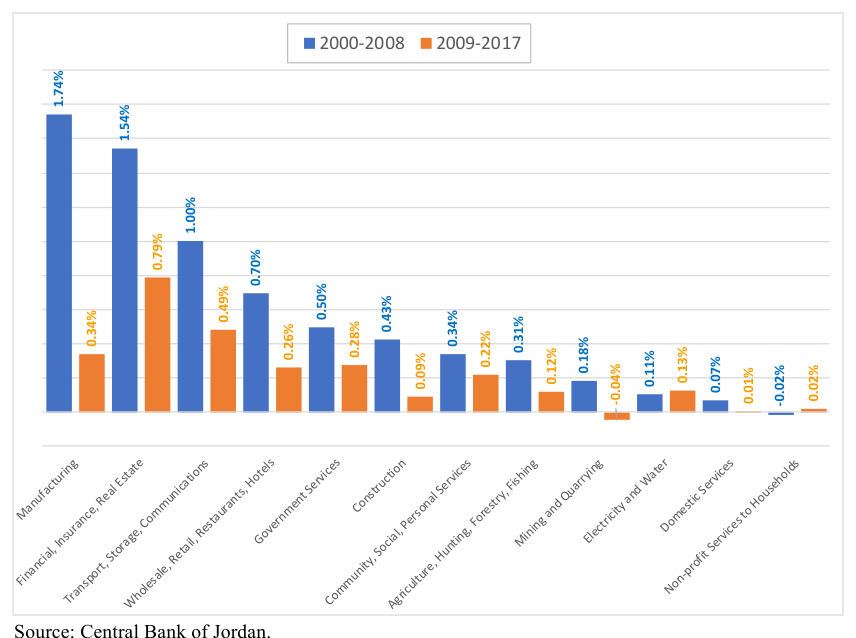
Source: Central Bank of Jordan.
2. External shocks: Impacts on exports and foreign direct investment (FDI)
Jordan’s growth trajectory from 2009 to 2018 has been negatively affected by various external shocks that had significant impacts on the country’s balance of payments. The Global Financial Crisis (2008-2009), the Arab Spring (2011), the Syrian civil war (2011), and the Daesh conflict in Iraq (2014), decelerated trade and investment flows at a global level, and in the case of Jordan, sparked a series of events that led to the closure of borders with key export markets, a massive inflow of refugees, and a disruption of the energy supply due to sabotage. The adverse effects stemming from these events impacted Jordan’s balance of payments by curtailing two key sources of foreign currency: exports and foreign direct investment.
2.1 Exports
It is important to keep in mind just how much these external shocks affected Jordan: both the economic boom and the ensuing slowdown were export-driven (Figure 4). From 2000 to 2008, Jordan’s exports grew by a factor of 3.6, expanding at a compounded annual growth rate (CAGR) of 17.3% per annum (14.1% in constant dollars). This went beyond a mere commodity boom: it entailed significant gains in market share for Jordan’s exports, in particular, for garments, chemicals, and agricultural goods. From 2008 to 2017, the more challenging external conditions and less dynamic market share gains slowed down export growth to a CAGR of 1.3% (-0.2% in constant dollars). Over this period, export performance can be broken down into two clearly differentiated sub-periods: between 2008 and 2014, export growth decelerated (3.4% per year, 1.8% in constant dollars), as global trade slowed down and Jordan’s market share gains in garment and chemical exports stagnated. After 2014, the intensification of armed conflicts in the region and the interruption of important trade routes caused exports to plummet by a cumulative 8.2% (11.5% in constant dollars). The downturn was particularly sharp in agriculture, transport and tourism.
Figure 4. Jordan: Exports of goods and services
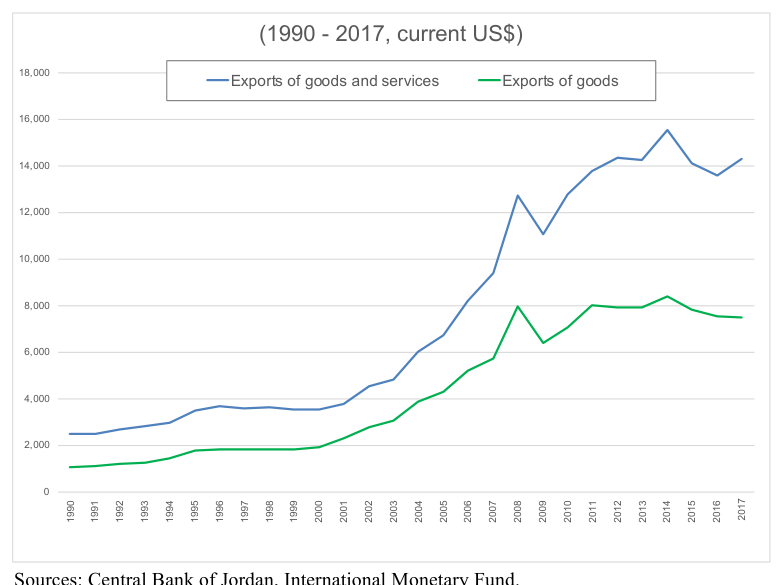
Sources: Central Bank of Jordan, International Monetary Fund.
The 2014 sharp fall in exports caught everyone by surprise . By the end of 2017, total exports of goods 6 were 20% lower than the IMF Article IV 2014 forecast; and 33% below the Article IV 2012 forecast. These gaps are quite significant, as they represent 4.7% and 9.5% – respectively – of Jordan’s 2017 GDP.
2.2. FDI
Another negative impact derived from the Global Financial Crisis and the regional instability sparked by the Arab Spring was the substantial slowdown in foreign direct investment (FDI). Throughout the years of expansion, Jordan had been running large current account deficits that were mostly financed by massive inflows of FDI. Foreign investment over the 2003-2009 period averaged US $2.1 billion – 12.9% of GDP – fueled by countries benefiting from the prolonged oil bonanza (Figure 5). The United Arab Emirates (UAE), Bahrain, Saudi Arabia and Kuwait, accounted for 50% of all FDI received by Jordan during this period. After the Global Financial Crisis – from 2010 to 2017 – FDI flows fell to an average of US $1.7 billion or 5.0% of GDP. New partners such as Malaysia, South Korea and Egypt came in to compensate for receding investment still flowing from UAE, India, the United States, Bahrain and Kuwait.
Figure 5. Foreign Direct Investment (2003-2017)
Source: Central Bank of Jordan
Changes in patterns of FDI flows occurred not only with regards to volume and country of origin, but also in terms of industry of destination. FDI in construction and manufacturing – which accounted for 73% of all FDI received by Jordan over the period 2003-2009 – fell by 63% and 38% respectively between 2009-2016. By contrast, the energy sector attracted US $4.4 billion – 38% of total FDI received over the period 2010-2016. ICT attracted an additional US $530 million during the aforementioned period.
3. Jordan’s macroeconomic and fiscal outlook
As a consequence of the harsher economic conditions, imports in Jordan suffered a very significant decline . Between 2014 and 2017, total imports fell by 10% (Figure 6), which, in real per capita terms, represents a 20% drop below 2014 levels and a 44% decline from their 2008 peak.
Figure 6. Exports and imports of goods and services
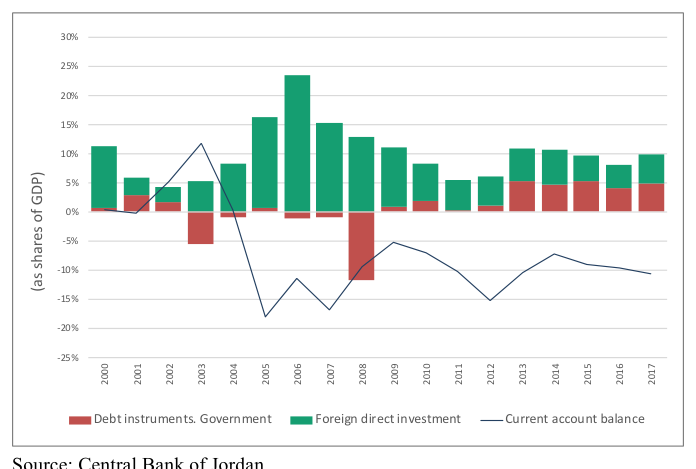
Source: Central Bank of Jordan In spite of the substantial decline in imports, the current account deficit remained large (Figure 7). More importantly, while until 2012 the deficit was financed predominantly through FDI, since then public external debt has played a much bigger role.
Figure 7. Current Account Deficit, FDI, and Foreign Public Debt
Source: Central Bank of Jordan The external shocks and the lower level of growth and imports together with the security challenges in the region and the costs associated with the Syrian refugee crisis, put Jordan’s fiscal accounts under severe strain.
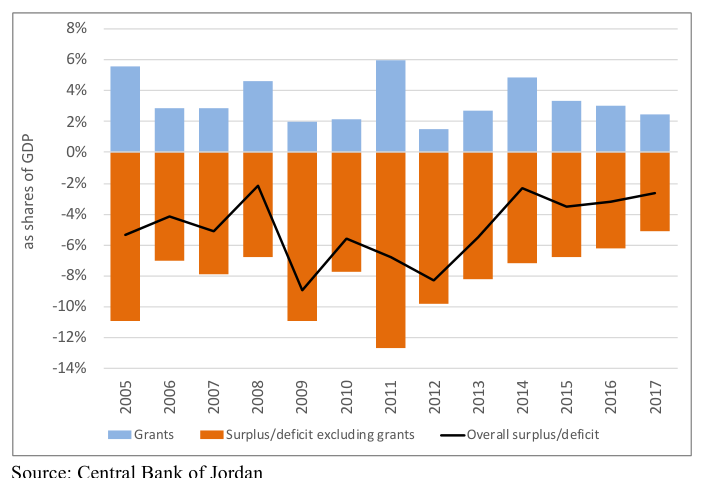
During the global financial crisis, Jordan’s fiscal accounts were severely hit. Between 2007 and 2011, tax revenues declined by a whopping 9.4% of GDP. The government responded with a large expenditure cut of 4.6% of GDP. As a consequence, the fiscal deficit — excluding grants— grew by 4.8% (from 7.9% to 12.7% of GDP) (Figure 8). Including grants the increase was much more moderate, only 1.7% of GDP (from 5.1% to 6.8% of GDP). 7 After 2011, Jordan’s continued fiscal adjustment reduced the deficit (excluding grants) by a massive 7.6% of GDP, down to 5.1% of GDP by the end of 2017 (2.6% of GDP including grants) . The very large fiscal adjustment was carried through higher indirect taxes (2.9% of GDP), decreased subsidies on goods (3.5% of GDP), and capital expenditures (1.4% of GDP). The magnitude of the fiscal adjustment in Jordan is one of the largest recorded in the world since the global financial crisis , ranking third only behind Jamaica (2009-2015; 8.5% of GDP) and Greece (2010-2016; 10.7%), but well ahead of Portugal (2010-2016; 6.1%) or Spain (2009-2015; 4.6%).
Figure 8. Jordan: Budgetary fiscal balance (2005-2017)
Source: Central Bank of Jordan The Jordanian economy proved to be remarkably resilient, as it continued to grow – albeit at a decelerating pace – in spite of the massive fiscal drag. Between 2011 and 2017, the fiscal impulse – defined as total fiscal expenditure excluding external debt payments, minus total fiscal revenues excluding grants – dropped by 8.1 percentage points of GDP. Countries that achieved comparable fiscal consolidations such as Jamaica, Greece, Spain and Portugal suffered deep recessions while Jordan achieved positive growth.
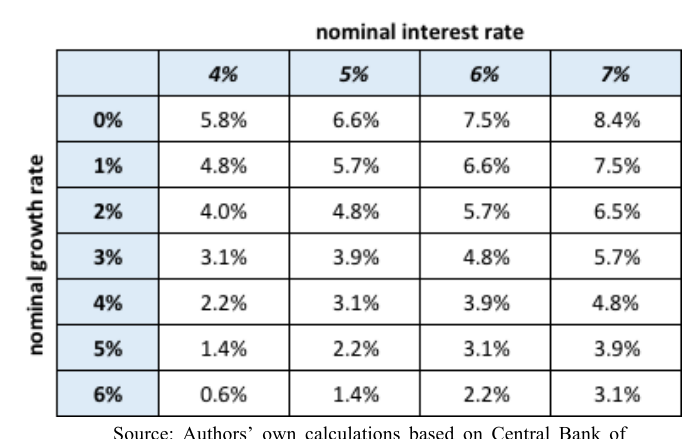
Yet, in spite of impressive fiscal adjustment, the gross debt to GDP ratio rose from 55% of GDP in 2009 to its current level of 94% of GDP. With a nominal GDP and a nominal interest rate of 6%, 8 the primary surplus would have to be 3.8% in order to stabilize the debt to GDP ratio and 5.7% if the goal was to reduce it to 77% by 2025. However, the primary surplus was only 1.7% in 2017.
However, further fiscal adjustment is not the only – or even the dominant way – to bring the debt to GDP ratio down. Table 1 presents the primary surplus required to bring the debt to GDP ratio to 77% by 2025 for different combinations of nominal growth rate and nominal interest rates interest rates. As the table shows, if the nominal growth rate could be accelerated to 6% (say 4% real growth and 2% inflation) and with an interest rate of also 6%, the debt to GDP ratio could be brought down to 77% with a primary surplus smaller than the one achieved in 2017. A similar
primary surplus would be needed if the nominal growth rate was only 5%, but the interest rate could be brought down from 6% to 4%. The implication is clear: the debt to GDP ratio can be put on a solid downward path if current levels of primary surplus are maintained or improved, growth is accelerated or financing is made available on softer terms.
Table 1. Primary fiscal surplus, growth and yields needed to achieve 77% of Debt-to-GDP by 2025
Source: Authors’ own calculations based on Central Bank of Jordan and Minister of Finance data.
Two important implications can be derived from this analysis. First, fiscal consolidation alone will most likely be insufficient to achieve debt sustainability in a reasonable timeframe. At current growth and interest rates, it would require significant further fiscal drag that is bound to keep growth low. Instead, the country could achieve fiscal consolidation if fiscal discipline is accompanied by a more aggressive growth strategy, accompanied by an international financial strategy aimed at reducing the average cost of its debt .
Secondly, given the need for continued fiscal discipline and the already large current account deficit, the growth strategy cannot depend on fiscal stimulus and domestic demand, but should instead be led by exports and by investments that directly or indirectly increase exports . Within such a context, considerations of comparative advantages become crucial.
4. An export-led growth strategy: comparative advantage considerations
4.1 High-cost electricity
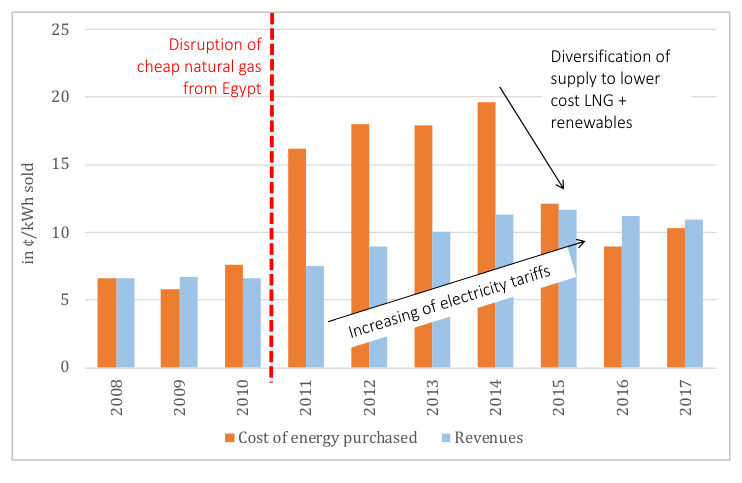
A significant portion of the net increase in debt registered in Jordan since 2008 has to do with the 2011 disruption in the supply of Egyptian natural gas to the energy sector during the Arab Spring. The disruption forced Jordan’s public electricity company NEPCO to substitute natural gas with diesel and heavy fuel oil at a time when oil prices were very high. The impacts can be observed in Figure 9: electricity generation costs more than doubled between 2011 and 2014, opening a significant gap in NEPCO’s revenues and costs.
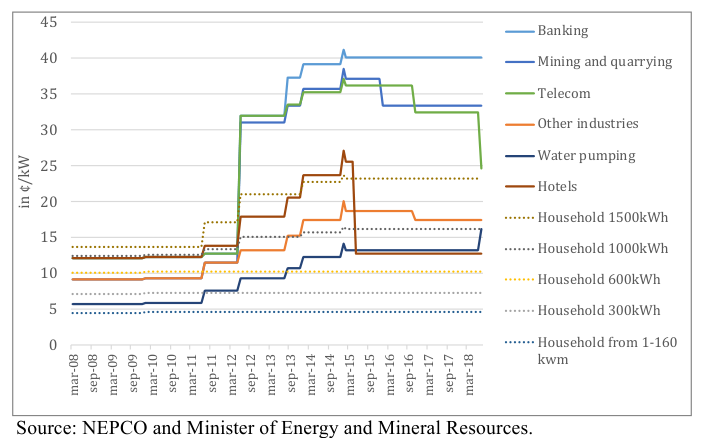
The government of Jordan reacted by increasing average electricity tariffs by raising them significantly on most industrial segments, while keeping them relatively constant to the vast majority of households. 9 At the same time, some aggressive actions were taken to move to cheaper sources of energy by developing the infrastructure needed to import liquefied natural gas (LNG). The government also launched public tenders for solar and wind generation, and entered into a series of long-term power purchase agreements (PPAs) aimed at achieving energy security.
Figure 9. NEPCO Costs and Revenues
Source: NEPCO and Minister of Energy and Mineral Resources.
By 2015 the balance between NEPCO revenues and generation costs had been restored, but the country did not escape unscathed from the 2011-2014 crisis. First, the gaps in NEPCO’s profits and losses over those four years resulted in US $7.3 billion worth of debt , which continues to loom over the system. Second, the way in which the tariff adjustments were made left a highly dispersed and cross-subsidized tariff structure . Whereas before the crisis the ratio between the highest and lowest electricity tariff was 2.7 times, at present the ratio is 8.0 times (Figure 10).
Figure 10. Electricity Tariffs (2008-2018)
Source: NEPCO and Minister of Energy and Mineral Resources.
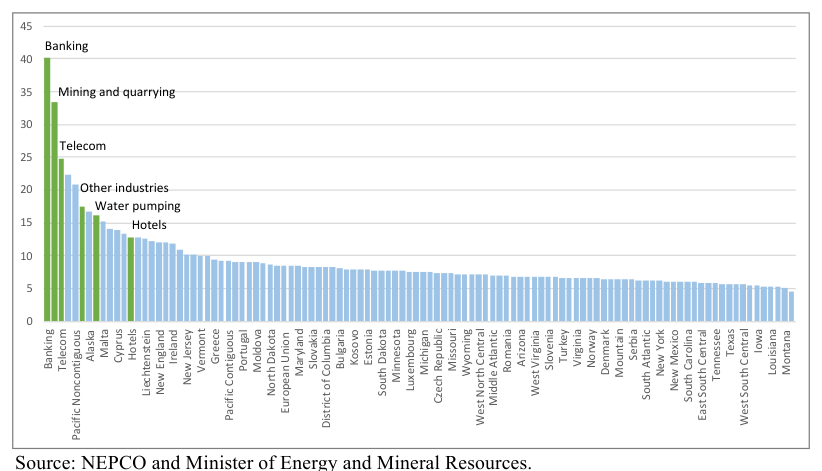
At last – as a joint result of the long-term PPA contracts signed by Jordan and the large cross-subsidies embedded in the tariff structure – electricity costs have become a binding constraint to growth and productive diversification in Jordan . Most industries faced a doubling of their electricity costs, and in several cases a tripling or quadrupling of the price over a decade. Electricity costs have become a threat to the competitiveness of both existing firms and potential tradable industries, constraining private investment, job creation, wage growth, and the overall resilience of its economy to cope with external shocks . Figure 11 presents a comparison of non-residential electricity tariffs that Jordanian industries are facing, compared to those prevailing in the Unites States of America at state level, and some selected European countries. The banking sector – to quote the most salient example – in Jordan is paying tariffs that are four times higher than three quarters of the sample places in the chart. More generally, all Jordanian industries are facing electricity costs that are higher – by orders of magnitude – than those prevailing elsewhere in the world .
Figure 11. Electricity Tariffs by Industry (2008-2018)
Source: NEPCO and Minister of Energy and Mineral Resources.
The spike in electricity generation costs had a significant negative impact on Jordan’s manufactures, which as a consequence of access to cheap gas had evolved to be relatively energyintensive (Figure 12). Thus, it is unsurprising that the growth collapse came at a time of manufacturing collapse – as electricity tariffs were rising sharply.
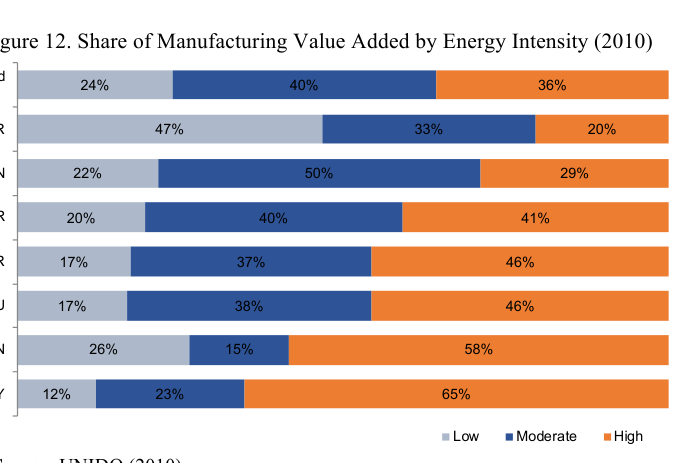
Source: UNIDO (2010)
The implications for Jordan’s growth strategy are clear: In the near term, Jordan must focus on promoting exports and investments on industries that support exports that are not intensive in the use of electricity . In the medium run, what is needed is a new energy strategy, aimed at lowering electricity generation costs by unlocking the potential of renewable energy and in particular solar, one of the country’s strongest comparative advantages. Lower energy costs will not only improve the competitiveness of Jordan’s industries, but will also reduce balance of payments pressures (by reducing the imports of fuel oil and natural gas) and have strong, positive implications for energy security (as conflicts in the region cannot alter the radiation of solar or speed of wind).
At present, solar and wind provide intermittent electricity, but storage technologies are improving at a very fast pace. Jordan’s energy strategy must allow the country to benefit from the cost savings derived from future technological improvements . This may require an update to the PPA agreements so that they can fulfill their complementary, flexible role within Jordan’s optimal energy mix.
4.2 The odd and changing character of factor endowment: Human Capital
One of the unusual characteristics of Jordan is the fact that it is a net importer of lowskill and a net exporter of high-skill workers. This is not only due to the predominant role of foreigners in low-skill, non-tradable activities such as construction or domestic service, as lowskill foreign workers play a very large role in some of the most important export activities such as such as agriculture, light manufactures and tourism (Figure 13).
Figure 13. Jordan Labor Force by Industry
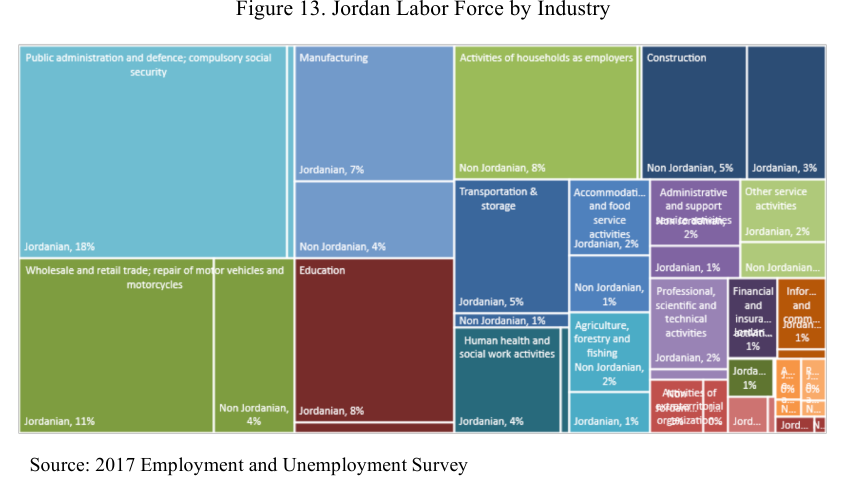
By the same token, many high-skill Jordanians tend to migrate to other countries for work while those that stay behind face very high unemployment rates. This suggests that the country’s export basket does not take advantage of the high-skilled human capital endowment that the country has built up.
This situation has an important gender dimension to it. By international standards, participation rates are low in Jordan across the board, but they are particularly low for lowskill women. While more than 58% of men with less than complete high-school education participate in the labor force, only 5.5% of women do. By contrast, men and women with postgraduate degrees participate at similar rates of around 73% (Figure 14).
Figure 14. Labor Force Participation by Gender and Schooling
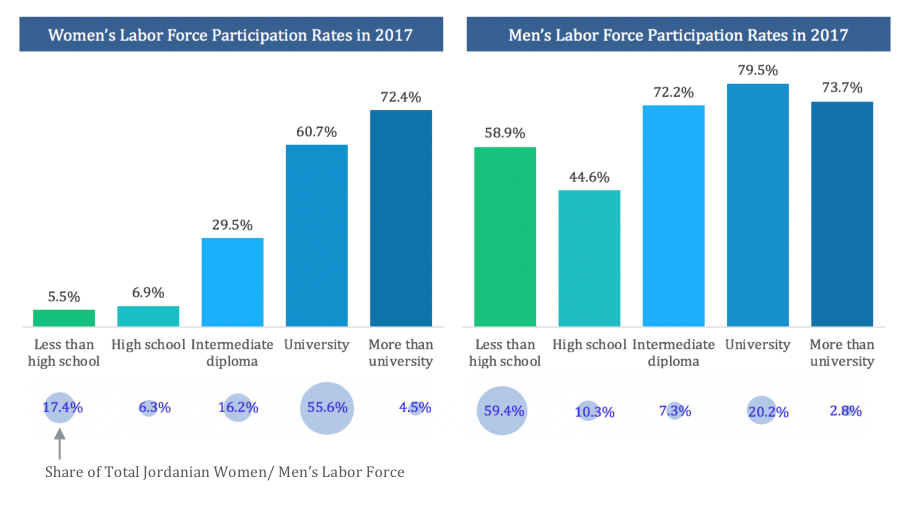
Source: 2017 Employment and Unemployment Survey This means that while women in Jordan are on average slightly more educated than men, the composition of the female labor force is dramatically more skilled than that of men, mainly because less educated women participate so little. So, while only 23% of men in the labor force have a university degree or higher, the rate is 60% for women. But this supply of female labor is largely wasted, as high-skill women face unemployment rates that are between two and three times higher than that faced by men with equivalent education (Figure 15).
Figure 15. Unemployment by level of education for Jordanian men and women
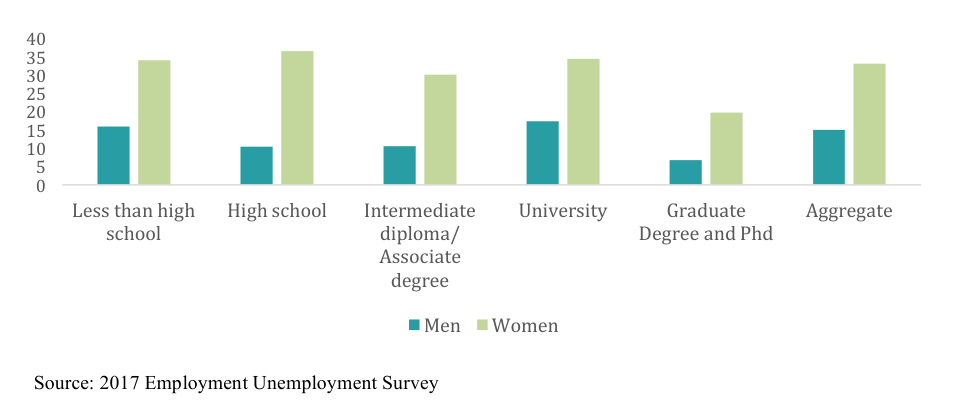
This situation is related to the fact that Jordanian women participating in the labor force have been largely restricted to a specific set of occupations in mostly high-skill industries. At present, education, healthcare, and public administration represent 30% of total employment but hire 68% of all employed Jordanian women and 81% of women with a post-graduate degree. The high concentration of employment in these three sectors suggests that these industries provide what are considered to be traditional female jobs.
While other economies are not exempt from having patterns of proportionally high female employment in certain industries, women tend to sort into a more diverse set of fields in other countries, a process that is still nascent in Jordan. In the United States, for example, 78% of healthcare and social assistance and 68% of education services employees are women. Yet 57% of legal services and 56% of finance and insurance employees are also women.
A possible explanation for the very high rate of female unemployment is that a disproportionate number of Jordanian women compete, or are queuing for, the same few, desirable or “traditional” jobs mentioned above. This queueing hypothesis is further supported by the unusually long duration of unemployment for Jordanian women. Long-term unemployment (more than one year) affects 72% of unemployed Jordanian women, compared to 58% of Jordanian men. This is not due to unusually high wage expectations, as the self-reported median reservation wage for unemployed women was 300 JOD in 2016, while median wages of employed Jordanian women was 350 JOD. 10
Moreover, education, health services and public administration have not grown fast enough to hire the pipeline of women who finish university education. Looking ahead, these three sectors could not possibly grow fast enough to provide more than a small fraction of the jobs that educated Jordanian women will be looking for. If we conservatively assume that tertiary enrollment and labor force participation rate by gender remain constant for the next ten years, the labor force will change massively towards high-skill workers: from 28.1% in 2017 to 40.5% in 2027. The share of men in the labor force with university degrees will climb from 20.2% to 30.3% but the share of women will increase from 56.7% to 68.3%. The total number of women with university degrees will increase by 85.7% and that of men by 77.2%. There is no conceivable scenario in which education, healthcare and public service will hire more than a fraction of them. To illustrate this point, we note that between 2010 and 2016, education and healthcare added about 3,000 female jobs a year. In the coming decade, we expect an increase in the supply of women with university education of 16,000 per year. Unless the country changes its areas of comparative advantage to reflect the growing endowment of educated and increasingly female workers, the accumulated human capital will be wasted (Figure 16).
Figure 16. Structure of labor force (actual and forecasted)
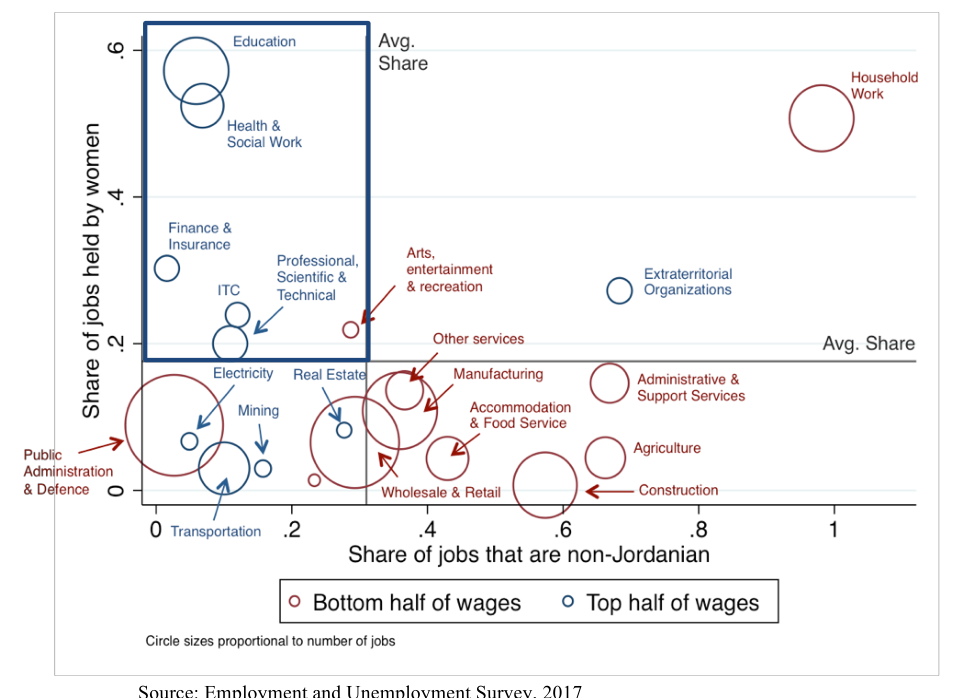
Therefore, the growth strategy needs to pay special attention to high-skill export activities that can hire more women. Figure 17 provides an indication of which sectors could include such activities. The figure shows employment of each industry group in Jordan along two dimensions: the share of jobs in the sector filled by Jordanians versus non-Jordanians (on the horizontal axis), and the proportion held by women (in the vertical access). Industry groups are shown as circles
that are sized according to their total employment. Red circles show that an industry group pays a median wage that is below the national median wage, while blue circle shows a median wage above the national median. It is clear from the figure that industry groups in the upper left corner are strategic for creating more job opportunities for high-skill Jordanian women. These industry groups include not just education and healthcare, but finance and insurance, professional, scientific and technical activities, and information and telecommunications.
This is a first indication that tradable service sectors should be an area of focus, because they are intensive in a factor of production that is already in excess supply and will be increasingly so in the coming years.
Figure 17. Jordanian labor market (2017)
Source: Employment and Unemployment Survey, 2017
4.3 Complementary high-skill immigration
One significant reason why the Jordanian economy does not more closely reflect its factor endowment of human capital is self-imposed by the country’s immigration policy. Jordan’s immigration system has historically been very liberal for low-skill workers, while being very restrictive for high-skill workers. This starves the economy of specific skills and experience that could be secured from the global labor market that would complement the skills and training of highly educated Jordanians. Econometric evidence and firm interviews provide strong evidence that this policy constraint is suppressing growth of high-skill, tradable services in Jordan that would otherwise be poised to grow.
Over the long-term, Jordan’s immigration policy has implicitly treated all foreign workers as if they are substitutes – assuming that one more job filled by a foreigner means one less Jordanian job – rather than recognizing the critical role that complements play in the Jordanian economy. This policy focus is especially evident within Jordan’s list of closed professions to foreigners, last updated in 2016. However, in the presence of labor complementarities – when one job filled by a foreigner with a specific skillset in short supply in Jordan allows for the creation of several Jordanian jobs – this policy focus can become a significant constraint on growth. This is, in fact, the reality that labor market evidence in Jordan makes clear. In effect, Jordan’s immigration policy is meant to achieve both national security and economic security, but by restricting access to the foreign workers that are complements, it is actually causing economic insecurity.
The presence of complementarities in key sectors that are tradable, support high wages and employ higher than average rates of college graduates and of women, can be exemplified by the experience of a few specific companies, while the prevalence of the trend can be understood through econometric tests . To understand the nature of complementarities, take the example of the global software company, Expedia, and its operations in Jordan. Expedia opened a software development branch in Jordan in 2017 and, by the middle of 2018, employed around 100 high-skill Jordanian software engineers, around half of whom were female. However, in order to put these skilled Jordanians to work, Expedia reported that they struggled to hire two foreign workers with global experience in Expedia’s business model that they could not supply in Jordan due to immigration policy restrictions. This constraint was overcome in the case of Expedia, allowing the company to create approximately 50 local jobs for every high-skill foreigner that it brought into the country, but it is unknown how many similar investment opportunities fall through because companies choose other countries in which to invest where they do not face the delays and transaction costs that the Jordanian system creates. This scale of complementarities of highskill foreign workers was found within other companies providing high-skill, tradable services that CID interviewed in Jordan.
Econometric tests using microdata from the 2017 Employment and Unemployment Survey confirm that this pattern is widespread in the Jordanian economy. Figure 18 shows the wage premium of foreign workers in Jordan versus their Jordanian counterparts, controlling for education and potential years of experience, for workers within the same occupation categories for four of Jordan’s largest sectors by employment: manufacturing, wholesale and retail trade, accommodation and food service, and construction. The survey data for these large sectors of the economy show that foreigners in most low-skill occupation categories – including “elementary workers”, “craft and related trade workers” and “services and sales” workers – receive a negative wage premium versus their Jordanian counterparts. In other words, these foreigners are paid less and tend to be substitutes. However, there is a large and statistically significant positive wage premium among the occupation category of “professionals”. The point estimates range from around 10% more in wholesale and retail trade to 35% more in manufacturing, suggesting strong complementarities.
Figure 18. Wage Differences of Foreigners versus Jordanians in Four Large Sectors
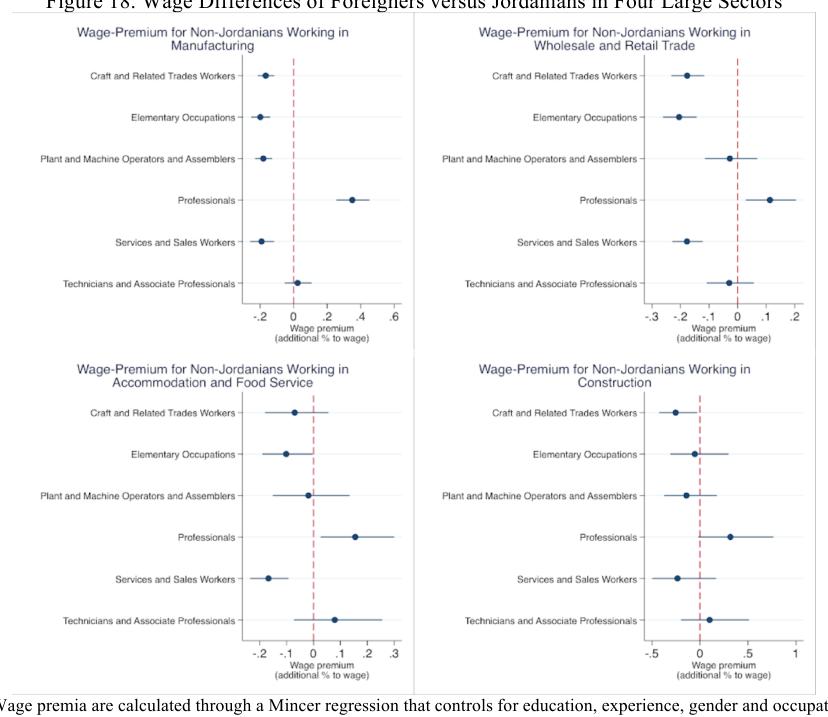
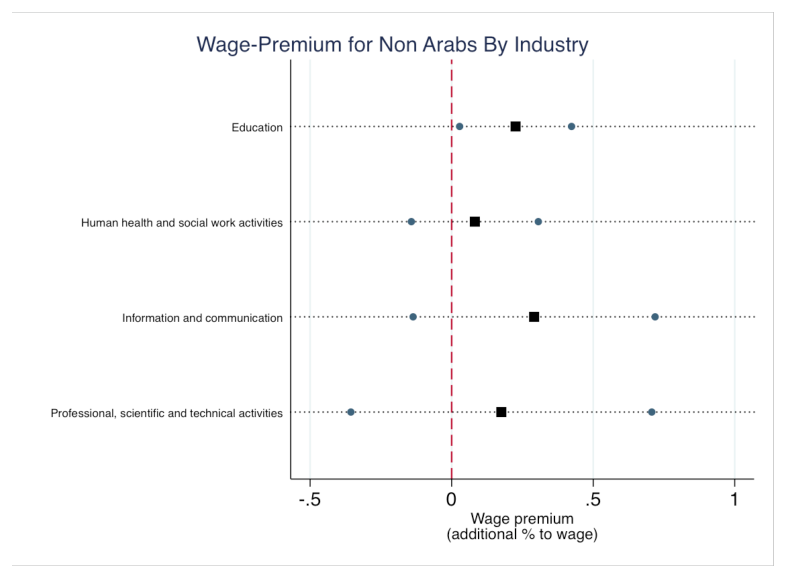
Though not usually thought of as high-skill on the whole, these four sectors of the economy – which are responsible for nearly half of private sector employment in Jordan – depend on specific skills of foreign professionals to fulfill some key tasks . If companies were not able to hire these foreigners in several professional and technician positions, it would result in Jordanians losing jobs. When the analysis is duplicated for professionals in key high-skill sectors where wages and female employment rates are higher than average, the results (Figure 19) show high point estimates for the wage premia paid to foreigners but with large statistical uncertainty. This is the result of immigration policy itself. Because foreign workers are restricted in many of these activities, very few foreigners appear in the annual survey. Because very few foreign workers are present, the ability of these sectors to expand and employ more high-skill Jordanians, including women, is constrained. The consequence is high unemployment and high rates of emigration for skilled Jordanians.
Figure 19. Wage Differences of Foreigners vs. Jordanians in High-Wage Sectors
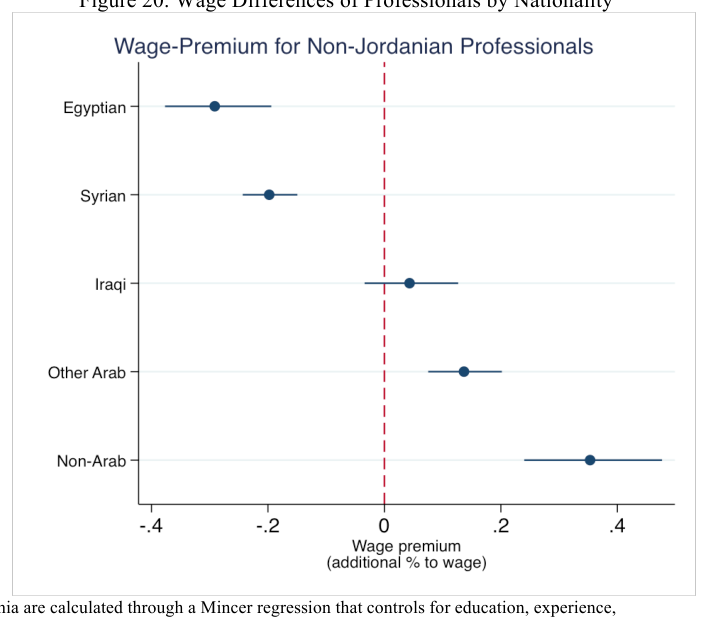
Estimating the wage premium paid to foreign professionals across all sectors of the economy and by nationality of origin (Figure 20) shows that complementary foreign professionals are coming from both Arab and Non-Arab countries, but the effect is especially strong for Non- Arabs. This mirrors the fact that – in order for companies from outside the Arab World (like Expedia) to set up operations in Jordan – they will often need to bring some of their workers from outside the Arab World as well. While this logic may be straightforward, it runs against the logic of Jordan’s 1996 Labor Code, which stresses that Arab “experts, technical specialists and workers” be given priority over other foreigners.
Figure 20. Wage Differences of Professionals by Nationality
One priority for a prosperous Jordan is therefore to resolve constraints to firms accessing high-skill and highly experienced foreign labor and to encourage entrepreneurs and businesses to set up operations in Jordan. Currently, critical restrictions apply on foreign workers in certain occupations and sectors as of 2016. The most glaring mismatch between the list of closed professions and the needs of the economy is engineering specialties, but the closed list
includes several other categories that tend to include professionals: medical specialties, all of education, administrative duties, accountants, communications jobs, and the electricity sector. Although exceptions can reportedly be made via an individual review process through a panel at the Ministry of Labor, the reliance on this process is completely incompatible with the potential growth rate of high-skill, tradable sectors in which Jordan should have a comparative advantage. The majority of global companies are not willing to deal with the delays, uncertainty and, ultimately, cost of this system. They will simply choose another country in which to invest instead. This causes Jordan to lose out on jobs for Jordanians and for potential sources of export growth.
5. Understanding Economic Complexity inclusive of services
For Jordan to grow its way out of the Balance of Payments constraint that the economy currently faces, it will need to maximize the growth potential from its greatest asset, its human capital, with an awareness of factors of production that are currently scarce and expensive. The theory of Economic Complexity – introduced by Hausmann, Hidalgo et al. (2011) – is based on the observation that structural transformation advances through the slow accumulation of productive capabilities and through learning-by-doing. One way to operationalize the concept is by using different measures of technological proximity between pairs of products, i.e. how similar are the capabilities and skills required to manufacture one product to those needed to manufacture the other.
The central idea is that places reveal their stock of productive know-how by the goods and services they are able to produce successfully and that future diversification of places tends to occur into products that are similar to those that they already produce. Places with higher agglomeration of productive knowhow will be able to manufacture more goods (more diversity) over time and goods that are increasingly more difficult to make (higher complexity). By the same token, places with little agglomeration of know-how, will only be able to produce a small number of goods of little technological sophistication, that on average many other places are able to make (high ubiquity). The basic tenets of complexity theory are expressed in indicators of economic complexity for places (economic complexity index, ECI) and products (product complexity index, PCI).
Several studies have been completed that study Jordan’s diversification opportunities using the tools of Economic Complexity , including a two-part study by the Jordan Strategy Forum in 2017. These studies reveal that Jordan’s ECI, as measured by its goods exports, has been falling over the last 20 years. This results in relatively few new diversification opportunities, and raises the question of what opportunities would emerge if services were included.
5.1. Incorporating goods and services: Dun and Bradstreet dataset
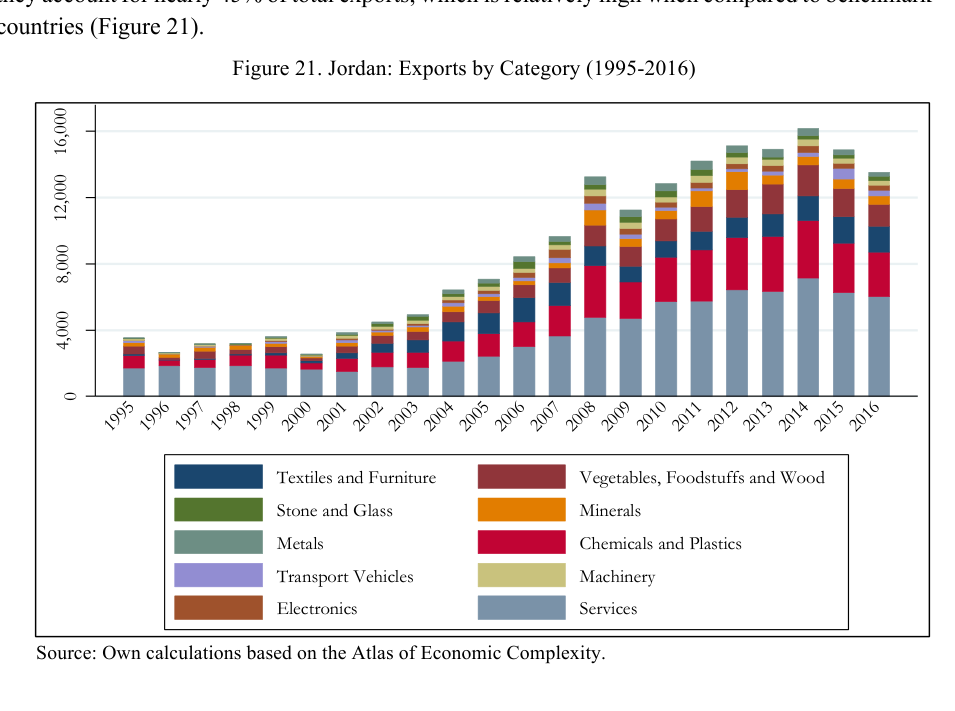
Services are of great importance for Jordan. In fact, exports of services by the country grew steadily from US $1.7 billion in 1995 to US $4.8 billion in 2008. Despite the strong impacts of the Global Financial Crisis (2008-2009) on the country’s economy, service exports only experienced a minor hiccup and in the following years went on to grow up to US $7.1 billion (2014). 11 Service exports continued to expand from 2009 to 2014 when goods exports stagnated. At present (2016), they account for nearly 45% of total exports, which is relatively high when compared to benchmark countries (Figure 21).
Source: Own calculations based on the Atlas of Economic Complexity.
In order to incorporate services into the complexity profile of Jordan we used the Dun & Bradstreet database (2015), which has representative employment information with broad international coverage and high industrial disaggregation for both goods and services. In doing so, some significant adjustments and adaptations to the original methodology were required .
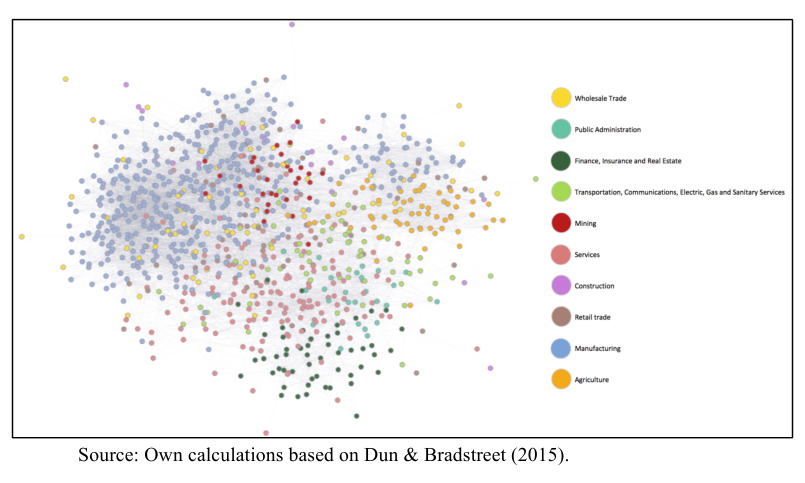
We estimate the productive capacities of places according to their relative intensity of employment in different industries. In doing so, we implicitly assume that the combination of capital and labor used to develop a certain industry is similar across countries. We compute proximity metrics between two industries based on the probability of co-production, both at the country and at the establishment level. That is to say that two products require similar capabilities if we observe with a relatively high frequency that they are manufactured (or rendered, in the case of services) within the same country, or within the same establishment. Based on these proximities we construct the Industry Space (Figure 22). Here, each node represents an industry, and the lines connecting them to those that are relatively adjacent from a technology standpoint. Different colors illustrate the sectors of the economy, which – as in the original product space – tend to cluster.
Figure 22. Industry Space (2015)
Source: Own calculations based on Dun & Bradstreet (2015).
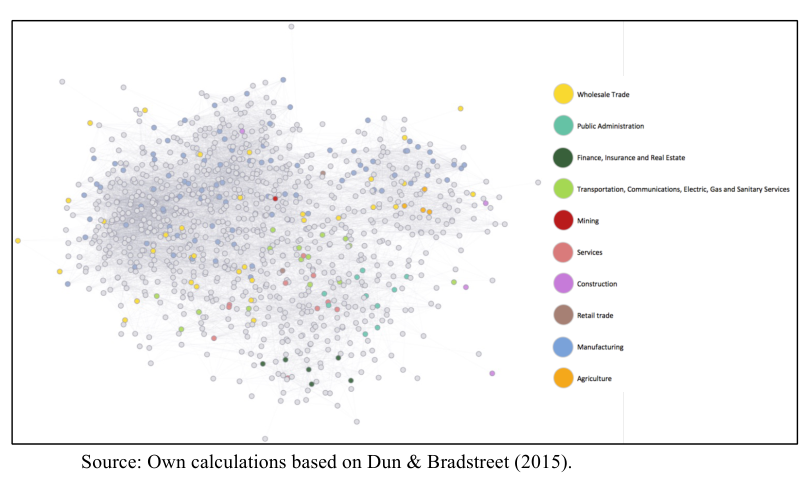
The relative position of Jordan in the Industry Space is shown in Figure 23, where we have highlighted in colors those industries where the country exhibit revealed comparative advantage (RCA), i.e. its share of employment in the industry is higher than the share of that industry in world employment. In general, we can conclude that it is somewhat sparsely populated and concentrated in manufacturing and wholesale trade (colors blue and yellow). Although a large part of the country’s presence in the Industry Space is given by these categories, in relative terms Jordan exhibits a high presence in others such as, public administration, transportation, communications and public utilities, and finance, insurance and real estate.
Figure 23. Jordan: Orientation in the Industry Space (2015)
Source: Own calculations based on Dun & Bradstreet (2015).
5.2. Identifying sectors with high potential
The process outlined here aims at providing a roadmap for export diversification for policy makers to rethink and target their productive development policies. Ultimately, target sectors should emerge from an iterative and dynamic process carried out jointly by the public and private sectors, taking into account the stock of productive knowledge, the considerations of shifting comparative advantages described above, and the particular constraints that might be hindering growth for the country in general, or some of these sectors in particular.
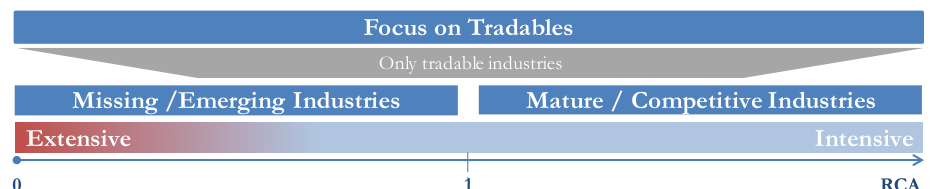
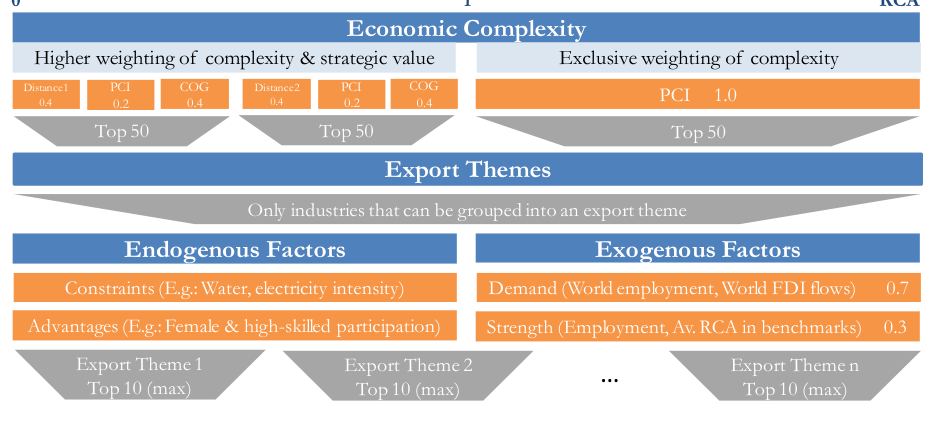
The specific process followed to identify and prioritize high potential industries is summarized in Figure 24 and explained below. In general, it relies heavily on the theory of economic complexity , which offers analytical rigor and impartiality. However, it also considers other relevant factors that influence the viability and desirability of the various options. Among them, some factors capture global employment and investment patterns, while others leverage information about Jordan’s advantages and constraints in its factor endowments. It is here where the connection between growth diagnostics and complexity analysis becomes particularly significant.
Figure 24. Sector Identification / Validation Process
0 1 RCA
Source: Own construction.
First, the process selects those industries that can be regarded as tradable, 12 a focus that is far from arbitrary. Given the prospects of continued fiscal consolidation, growth cannot depend on fiscal stimulus. At the same time, the fact that the current account deficit is already large means that growth cannot be led by increases in domestic private demand for non-tradable goods, as these will require more imports that would worsen the external balance. As stated before, Jordan’s growth strategy must be driven by exports and investment that either directly or indirectly supports export growth. Jordan’s abilities to achieve sustainable and inclusive export-led growth will depend on maximizing the potential of existing industries (the intensive margin), and attracting new business models that build on Jordan’s existing knowhow and capabilities (the extensive margin).
Based on economic complexity metrics, industries are selected from the “tradables” pool. This is the cornerstone of the methodology, as it is at this stage when the industries to be later prioritized are defined. The main idea here is to identify nearby industries that can leverage on the know-how already in place to advance in its path towards greater levels of complexity and development. However, places usually face an important trade-off: the most complex industries or those with the best strategic positioning in the Industry Space tend to be further away from existing capabilities, while less complex industries tend to be closer.
In view of this trade-off, the methodology tries to balance these different considerations by giving positive weights to three different metrics. On the one hand, the variable “distance” (the inverse of proximity), measures how similar those industries are in terms of know-how to those already present in the country. On the other hand, the “product complexity index (PCI)” measures how complex or sophisticated a certain industry is and, the “complexity opportunity gain (COG)”, to what extent it can lead the way to other, more complex industries (strategic value).
Given the need to diversify into exports of higher economic complexity, in weighing the different complexity metrics we have given greater importance to absent industries (the extensive margin) that are above the current complexity average. In specific, together, PCI and COG, are given a 60% weight, while distance is given the remaining 40%. For industries where Jordan currently exhibits RCA (the intensive margin), the distance indicator is zero, and their strategic value has already been captured (the country is “already there”). Therefore, on the intensive margin, only PCI is considered.
As it was stated above, co-production patterns to calculate distance between industries, thanks to the granularity of the data coming from Dun & Bradstreet, can be measured at several levels. Due to limitations in the availability of the database, it is not evident at which level the indicator has a stronger capacity to predict the diversification trajectories of countries. 13 For this reason, the methodology considers the two different approaches – measuring proximity at the country level and establishment level – and selects 50 missing/emerging industries in each case.
Once there, the industries selected through the economic complexity filter – regardless of whether they are on the extensive or the intensive margin – are classified into groups of related industries. This process is facilitated by the existence of various classification systems, but it also involves some discretionary decisions. The groups that concentrate most of the selected industries are then aggregated into export themes.
The first type of the exogenous factor considered – and one that carries the heaviest weight – has to do with demand considerations. The theory of economic complexity is mainly an analysis of supply, based on the overlap between the productive capabilities required to develop 13 To test that, several observations in time would be required. Unfortunately, CID currently only has access to the Dun & Bradstreet database of one year (2015).
a new industry and those that are already available. While these elements play a decisive role in determining the probability of success of an industry, they say nothing about the potential demand for it. Unfortunately, given the broader focus to include both goods and services in the analysis, no shared direct measure of demand is available. Therefore, we rely on indirect measures that aim at capturing the relative size of global demand for the different industries. The first one corresponds to total world employment , i.e. we assume that industries facing higher demand need to employ more people to meet it. 14 Although a greater number of jobs may not always reflect a higher demand, the risk of this not being the case is expected to be low in the case of tradable industries, which are the focus of this analysis.
Our second proxy for demand is the world’s flows of foreign direct investment (FDI). In this case, the rationale is that investors invest more in the industries that are expected to face a higher demand. For purposes of constructing this measure, information from the fDi Markets database was used. Although this information is available for a classification system different from the one used here and for a less granular aggregation level, we developed a crosswalk that allows to assign foreign direct investment flows to the industries of interest.
A second type of exogenous factor corresponds to the “strength” in Jordan’s benchmarks countries. The underlying logic is that if an industry has developed successfully in similar contexts, then it should be relatively more feasible in Jordan. In this way, a high level of strength does not guarantee the success of the industry, but it does make it more likely. In specific, both total employment and the average relative intensity of employment (RCA) in benchmark countries are considered to measure this factor. Since it corresponds to a consideration of supply, a dimension that is already well addressed, the strength factor is assigned a lower weight than demand factor.
The demand and strength factors are exogenous to Jordan. However, other factors with the capacity to affect the viability of the different industries are specific to the country (endogenous factors). Broadly speaking, export growth in Jordan should not only capitalize on world demand and specialization trends but on the country’s comparative advantages as well. At the same time, it should avoid (at least initially) sectors that are intensive in the factors that represent a binding constraint for economic growth in Jordan.
As highlighted above, a highly educated workforce is one of the country’s comparative advantage. In this context, the long-term increase of highly educated women has been particularly noteworthy. On the other hand, our growth diagnostics points to the high cost of energy and water scarcity as two of the most important binding constraints in Jordan. While this stage of the analysis
has yet to be completed, the growth strategy shall initially prioritizes industries that tend to employ high-skilled labor and women, as well as those that show a low intensity of use of electricity and water.
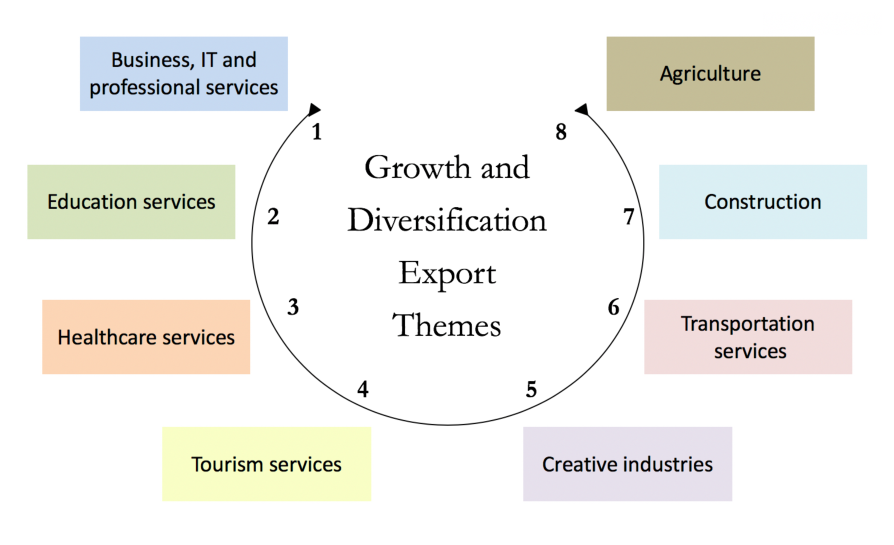
The industries that emerged from this analysis have been grouped into eight themes, 15 which provide a roadmap for structural transformation and export diversification for Jordan over the next several years. Figure 25 describes the eight export themes and Figure 26 identifies the industries within each theme that have the highest ranked within the process described earlier. Within each theme, we have highlighted in bold industries where Jordan already has revealed comparative advantages, but can continue growing (the intensive margin). All others are industries that are either non-existent in Jordan, or exhibit an intensity of employment that is smaller of what we would expect given their overall score.
Figure 25. Export Themes
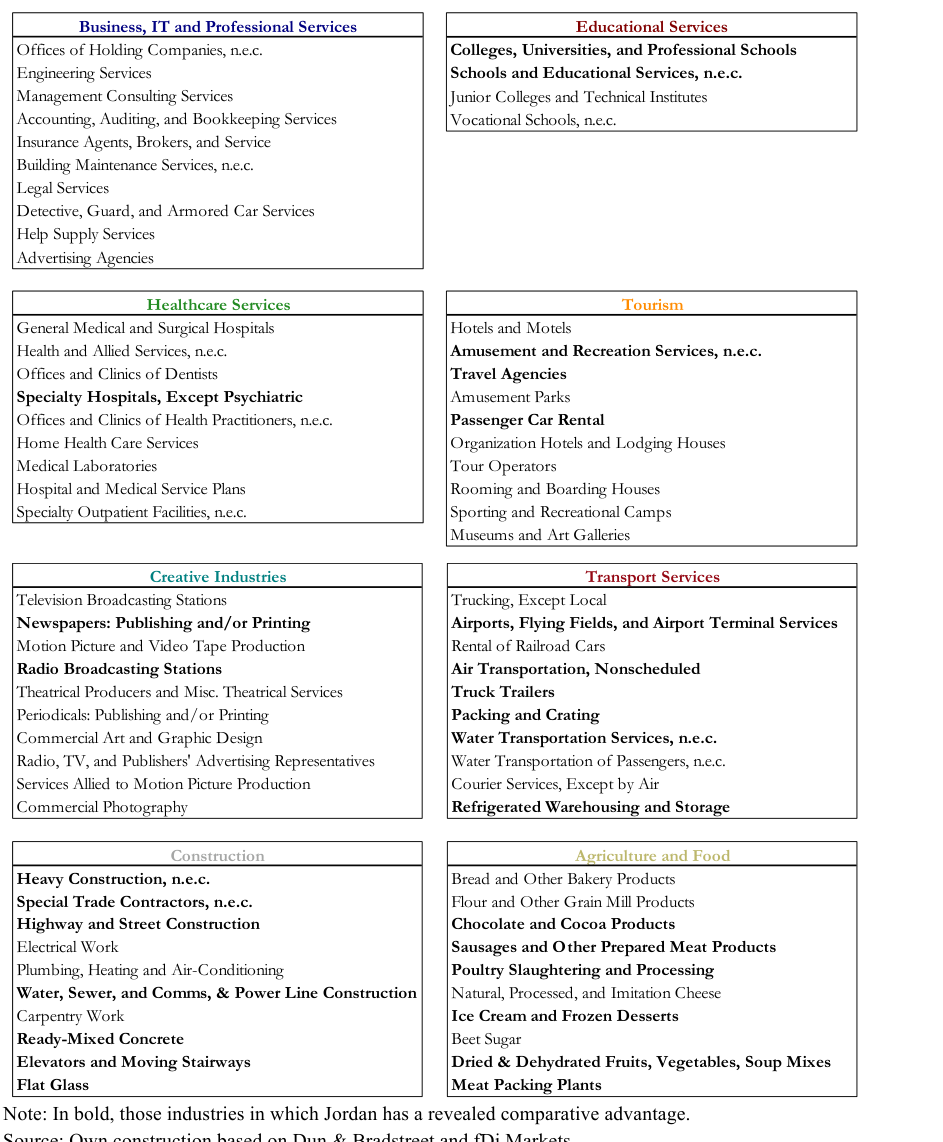
Note: In bold, those industries in which Jordan has a revealed comparative advantage. Source: Own construction based on Dun & Bradstreet and fDi Markets.
6. Integrating these elements into a framework for growth strategy
Today, Jordan is facing a challenging situation that is testing once again its resilience, strength, and national character. It is not the first time and – given the history of the neighborhood – it will most likely not be the last one either. Back in 1999, when Abdullah II became king, the country faced a similar set of challenges. The region’s economy was suffering from the fallout of Iraq’s invasion of Kuwait. Most Gulf countries dramatically cut back their loans, grants, and investments in Jordan, and the crisis also put strain on remittances. The imposition of sanctions on Iraq disrupted not only trade with a critical export market, but also the supply of oil that Jordan had been getting on concessional terms. Growth, which registered an average of 7.1% between 1990-1995 (2.0% per capita), slowed to 2.9% between 1995-1999 (0.6%). The government had to rely on foreign borrowing, driving debt-to-GDP ratios up to 100% by the end of 1998.
Jordan managed to adapt and emerge from this challenge in a stronger economic position than ever before. It did so through an aggressive combination of fiscal consolidation, international financing – a program with the International Monetary Fund and a rescheduling of its debt payments with the Paris Club – and an aggressive export-based growth strategy (leveraged through admission to the World Trade Organization in April, 2000). As exhibited at the start of this paper, the three-pronged strategy launched Jordan into a period of accelerated growth, with exports of goods and services tripling over 2000-2008, and income per capita growing a cumulative 34.3% over the same period. Jordan achieved this transition through evolving its own policies to respond to a changing world and through collaborative support from the international community.
Jordan’s challenges today are similar in nature, but much larger in magnitude. A sequence of large and persistent shocks – the Global Financial Crisis, the Arab Spring, the Syrian refugee crisis, and the Daesh conflict in Iraq – have thrown its economy out of balance. As was the case in previous crises, the country relied on issuing foreign debt to support government spending, driving debt-to-GDP ratios from 55% in 2009 to 94% by the end of 2017. The country entered into a Stand-By Agreement with the International Monetary Fund (IMF) in 2012, which turned into an Extended Fund Facility in 2015. With the support of the IMF, Jordan has implemented several significant reforms aimed at reducing the public deficit. A large fiscal consolidation has taken place, mostly driven by indirect taxes, elimination of subsidies, and large cuts in public investment.
A number of factors have caused Jordan’s debt-to-GDP ratio to remain constant in spite of the large fiscal adjustment. First, the fact that Jordan needed to issue significant amounts of foreign debt between 2011 and 2015 suggests that the IMF program was underfunded. As a consequence, Jordan had to resort to international financial markets at a time when its economy was far from stabilized, which resulted in high yields. Second, in spite of the tightening of the
fiscal deficit, the current account deficit has been persistently large and continued to widen since 2014. Third, the pro-cyclical fiscal response – tightening fiscal expenditures with the economy decelerating – depressed growth further, and at a time when Jordan has taken on the extraordinary additional burden to its government services and labor market functionality that comes from hosting more than one million refugees.
In spite of significant efforts, the need for fiscal consolidation is likely to continue. In order to bring foreign debt onto a sustainable path, Jordan needs to pursue an international finance strategy aimed at reducing the cost of funds, while promoting a more aggressive growth strategy. Given the prospect of continued fiscal consolidation, the growth strategy cannot depend on domestic demand, but rather must be led by exports and investments that directly or indirectly increase exports. In order for the non-tradable economy to expand, Jordan must expand its exports, and this will require adapting to changes occurred within Jordan, in the region, and also in. the global economy since its previous export boom. Additionally, during the previous period of high growth and export expansion (2000-2008), much of the growth in exports relied low-skill sectors that created little employment for Jordanians (garments and agriculture) and/or relied on low-cost energy (basic chemical products). These drivers of past export growth are poorly matched with the comparative advantages in factor endowments that Jordan enjoys today.
The path forward for Jordan that follows from this paper can be seen in schematic form in Figure 27 below. Understanding the growth opportunities of the tradable economy requires first recognizing the characteristics of the associated labor market in broad terms. Jobs in the tradable economy are a mix of low-skill jobs, primarily focused in goods exports, and higher-skill jobs, which are more matched to service exports. Low-skill jobs in the tradable economy are currently filled a high rate by non-Jordanians and tend to pay below average wages, whereas highskill jobs pay higher wages and are largely filled by Jordanians. The country currently has surplus labor (seen in high rates of unemployment) among its growing supply of highly educated individuals, especially women, and its supply of less educated foreigners, in particular Syrian refugees.
It is important for Jordan to focus policies and international support in ways that will help all parts of the tradable economy to grow, but it is especially important to focus attention on those parts of the tradable economy that can support higher wages. High-wage, tradable jobs provide a direct boost to demand for non-tradable goods and services because more of those wages end up paying for retail, restaurants, travel and transportation services in the non-tradable economy. While the high-wage jobs are strategic because they can absorb higher rates of female labor, the spillover benefits in the non-tradable economy are especially important for expanding opportunities for flexible work to lower-skill workers, including refugees.
Figure 27. A Schematic of Jordan’s Growth Strategy
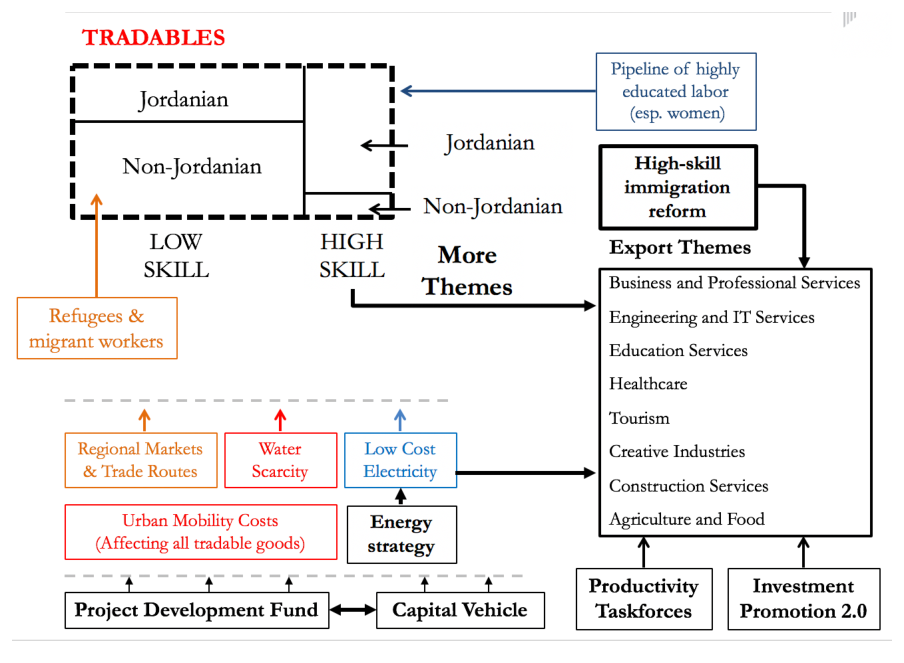
Jordan’s comparative advantages in exports are influenced by constraints and opportunities within the country and by conditions in the region and the global economy. Policymakers must be aware of these factors, and must use this knowledge to orient policymaking around solving priority constraints that have left latent comparative advantages unfulfilled and taking advantage of new opportunities that emerge as conditions change. One significant constraint – as discussed in this paper – is the high cost of electricity. However, new opportunities are now emerging that can allow Jordan to release this constraint by taking advantage of its abundant natural resources for low-cost, renewable generation. This is a critical component of a growth strategy for Jordan in the medium term, but it is necessary that exports expand in the shorter term in activities that are less intensive in the use of energy and electricity.
Though not discussed in this paper, other significant constraints in Jordan noted in Figure 27 include the overall scarcity of water and inefficiencies in urban mobility stemming from weak public transportation systems. Given its scarcity, the cost of water as a factor of production is driven by the cost of electricity to pump water. Meanwhile, poor quality public
transportation in urban centers manifests itself in higher costs of labor across nearly all economic activities and requires that companies that need to be globally competitive are forced to cluster within narrow geographical areas (such as around King Hussein Business Park in Amman or near the Jordan University of Science and Technology outside Irbid) to access the labor they need.
The Economic Complexity analysis described in Section 5 of this paper – which is inclusive of service exports for the first time – quantitatively explored what export themes are most strategic for Jordan and included considerations of the advantages and disadvantages described above. The analysis identified eight export themes as most strategic given the exhibited capabilities of the Jordanian economy and global trends in demand. Industries at a detailed level emerged in the following themes: (1) business, IT and professional services, (2) education services, (3) healthcare services, (4) creative industries, (5) tourism, (6) transportation and logistics, (7) construction materials and services, and (8) agriculture and food processing. These industries range from those that already have a revealed comparative advantage (RCA) to those that either do not yet exist in Jordan, or exist with a much lower intensity than would be expected, given Jordan’s existing capacities and know-how. Maximizing opportunities for growth across this spectrum demands a mix of government actions and international support.
The majority of these export themes represent activities that are intensive in highly educated labor, and not intensive in water or electricity. This is the case for IT and professional services, education, healthcare, creative industries and construction services in particular. All of these high-skill service industries face a pressing constraint that is self-inflicted in Jordan by current immigration policy. For these industries to thrive, firms need to be able to access global talent. As described in Section 4.3, easing access to foreign talent will not be expected to reduce job opportunities for Jordanians in these industries, but rather to allow them to expand significantly, creating many more Jordanian jobs than they do foreign jobs. If this were not the case, then the firms would not be trying today to enter Jordan to take advantage of the talents and cost advantages that Jordanian labor provides.
These export themes also share widespread opportunities to serve the region. Business, IT and professional services include the opportunity for Jordan to expand much more quickly as a base for back-office services of multinational companies and serve as a launching point for global companies’ entry into the Middle East. Across these themes, there also emerges an opportunity for Jordan to be a place that provides necessary services (construction, healthcare, education) to neighbors in the region as they emerge from conflict and to create the IT-enabled innovations of the future that solve pressing problems of the region.
Other export themes, including tourism as well as agriculture and food processing in particular, exist further along the low-skill and lower wage end of the spectrum. Their expansion would include job growth that is more evenly spread between Jordanians and
foreigners. In the short term, these themes will continue to face more disadvantages in the cost of water and electricity because they are more intensive in these inputs than the other themes. However, they are extremely important for export volumes, overall employment, and the inclusiveness of growth across regions of Jordan. Over the past few years, Jordan has seen tourism promotion efforts pay off as the region has seen some improvement in stability, but much more growth is possible. Meanwhile, agriculture and food exports took a significant hit due to regional shocks in recent years. Long-term growth in this theme may require new private sector actors and creative government efforts to build value chains that are less reliant on the region and to adapt to long-term challenges like water scarcity and newer challenges from a changing climate.
Beyond the specific constraints faced by each theme and by different industries within each theme, there are three broad ways that the Government of Jordan can support a transformation in growth: (1) active and targeted investment promotion; (2) improved mechanisms for public-private collaboration toward solving industry-specific problems; and (3) improved capabilities for prioritizing and delivering public investment projects.
For high-potential industries that either do not exist or exist with a low intensity, we recommend targeting investment promotion efforts around these eight export themes and focusing government resources around targeting high-likelihood companies based on their past investment decisions and stated business objectives. The task should fall upon the shoulders of the Jordan Investment Corporation (JIC), which may require new resources and a new institutional mindset in order to continuously and iteratively engage with prospective investors in the high-potential industries to facilitate new foreign direct investment.
In order to promote faster growth on existing sectors, we recommend instituting new and stronger mechanisms for public-private problems solving of industry-specific problems. One tool for this that is used in other countries but that has been underutilized in Jordan is the presence of “Productivity Taskforces,” which are working groups made up of private and public sector individuals, that meet regularly to identify the most binding constraints preventing the full potential of key industries. Such working groups defined around a number of the identified export themes would have the potential to significantly accelerate the growth of existing industries by revealing constraints to productivity growth that are hidden to government unless it works collaboratively with the private sector.
Finally, despite available finance for a number of large-scale public infrastructure investments, Jordan exhibits a pattern of slow development of necessary infrastructure, including in water, energy and transportation. Moving forward, the Government of Jordan must develop new capabilities to prioritize, advance, and finance bankable infrastructure projects. Such capacity is essential to support the mobilization of private capital and improve the efficiency and expediency of public investment. There are a number of institutional arrangements
developed in other countries, as well as sub-nationally in Jordan, which could be leveraged at the national level.
Promoting exports and export-related investment through these various efforts will have spillover impacts into the non-tradable sector, an impulse that today cannot come out of the fiscal budget . Faster growth, together with an international financing strategy aimed at reducing the funding cost – preventing Jordan from issuing debt in the international markets as long as its economy is not fully stabilized – are the key elements to pull the economy out of the crisis and get the country on a path of sustainable growth.
Figures
Tables
References
Balassa, B. (1965). “Trade liberalization and revealed comparative advantage”. The Manchester School, Volume33, Issue2, May 1965, pp. 99-123 Hausmann, Ricardo, and Bailey Klinger (2006). “Structural Transformation and Patterns of Comparative Advantage”, CID Working Paper.
Hausmann, Ricardo, Cesar Hidalgo, Sebastián Bustos, Michele Coscia, Sarah Chung, Juan Jimenez, Alexander Simoes, and Muhammed Yildirim (2011). “The Atlas of Economic Complexity”. Puritan Press. Cambridge MA.
International Monetary Fund (2012). Jordan: Staff Report for the 2012 Article IV Consultation , May 22, 2012.
International Monetary Fund (2014). Jordan: Staff Report for the 2014 Article IV Consultation, Third and Fourth Reviews Under the Stand-By Arrangement, Request for Waivers of Nonobservance of Performance Criterion and Applicability of Performance Criteria , June 9, 2014.
International Monetary Fund (2017). Jordan: 2017 Article IV Consultation-Press Release; Staff Report; and Statement by the Executive Director for Jordan . June 24, 2017.
International Monetary Fund (2018). Jordan: Preliminary Macro-Framework. December 11 th , 2018.
Kar, S., Pritchett, L., Raihan, S., and Sen, K. (2013). “Looking for a break: Identifying transitions in growth regimes”. Journal of Macroeconomics, Vol. 38, pp. 151-166.
Wald, A. (1943). “Tests of Statistical Hypotheses Concerning Several Parameters When the Number of Observations is Large,” Transactions of the American Mathematical Society , 54, (1943), pp. 426-482.