Abstract
In the thirty years that have passed since independence, Namibia has been characterized by its overreliance on its mineral resource wealth, procyclicality of macroeconomic policy, and large income disparities. After an initial decade marked by nation building and slow growth (1990-2000), the Namibian economy embarked on a rapid growth acceleration that lasted 15 years, within the context of the global commodity super cycle.
Transcripción completa del PDF reformateada para lectura web. Descargar PDF original para tablas, figuras y referencias.
• Copyright 2022 Hausmann, Ricardo; Santos, Miguel; Barrios, Douglas; Taniparti, Nikita; Pye, Jorge; Muci, Jose Francisco; and Lu, Jessie; and the President and Fellows of Harvard College
Ricardo Hausmann, Miguel Angel Santos, Douglas Barrios, Nikita Taniparti, Jorge Tudela Pye, Jose Francisco Muci, and Jessie Lu
Published February 2022
Growth Lab
Center for International Development Harvard University
Glossary
The following glossary is meant to provide an intuitive explanation for some of the jargon related to the framework of economic complexity found in this document. Additional mathematical detail can be found online at the Growth Lab website: www.atlas.cid.harvard.edu/glossary Economic Complexity A measure of the knowledge in a place as expressed in the products it makes. The economic complexity is calculated based on the diversity of products a place produces and their ubiquity, or the number of the places able to produce them (and those places’ complexity). Places that are able to sustain a diverse range of productive knowhow, including sophisticated, unique knowhow, are able to produce a wide diversity of goods, including complex products that few other places can make.
Economic Complexity Index (ECI)
An index of places based on how diversified and complex their production basket is. Places that are home to a great diversity of productive knowhow, particularly complex specialized knowhow, are able to produce a great diversity of produce, including highly unique products. The complexity of a place’s production is found to be highly predictive of current income levels, or where complexity exceeds expectations for a place’s income level, the place is predicted to experience more rapid growth in the future. ECI therefore provides a useful measure of economic development.
Complexity Outlook Index (COI)
A measure of how many complex products are near a place’s current set of productive capabilities. The COI captures the ease of diversification for a place, where a high COI reflects an abundance of nearby complex products that rely on similar capabilities or know-how as that present in current production. Complexity Outlook captures the connectedness of an economy’s existing capabilities to drive easy (or hard) diversification into related complex production. A low complexity outlook indicates that a place has few products that are a short distance away, so it will it difficult to acquire new know-how and increase its economic complexity.
Knowhow Knowhow is the tacit ability to produce a product. Also known as productive capability, knowhow refers to productive knowledge that goes into making products. Places grow faster by diversifying the productive knowledge they have to make a wider variety of products of increasing complexity. Knowhow, as tacit knowledge that only exists in brains, stands in contrast to embedded knowledge where all knowledge is held in technology (e.g., in an iPhone); and codified knowledge, where all knowledge is explained and detailed in codes or blueprints. Knowhow is better conceived as the ability to walk, as tacit knowledge that cannot be fully explains using words and is the slowest to transfer by requiring time-intensive processes of imitation and repetition. While embedded knowledge (e.g., iPhones) can be shipped across the world and codified knowledge (e.g., Wikipedia) can be accessed through media, we believe it is the slow transfer of knowhow that explains the slow, incomplete diffusion of technology and production around the world and stands at the heart of the economic growth process. Policies that aim to speed up the diffusion of or diversify the knowhow of a society hold important implications on the pace of economic growth – and its fairness.
Complexity Outlook Gain (COG)
Measures how much a location could benefit in opening future diversification opportunities by developing a particular product. Complexity outlook gain quantifies how a new product can open links to more, and more complex, products. Complexity outlook gain classifies the strategic value of a product based on the new paths to diversification in more complex sectors that it opens up. Complexity outlook gain accounts for the complexity of the products not being produced in a location and the distance or how close to existing capabilities that new product is.
Product Complexity Index (PCI)
Ranks the diversity and specialization of the productive knowhow required to produce a product. PCI is calculated based on how many other places can produce the product and the economic complexity of those places. In effect, PCI captures the amount and sophistication of knowhow required to produce a product. The most complex products (that only a few, highly complex places can produce) include sophisticated machinery, electronics, and chemicals. The least complex products (that nearly all places including the least complex can product) include raw materials and simple agricultural goods. As an example, specialized machinery is said to be complex as it requires a range of knowhow in manufacturing, including the coordination of a range of highly skilled individuals’ knowhow.
Revealed Comparative Advantage (RCA)
A measure of whether a place produces a certain good, based on the relative advantage or disadvantage a place has in the export of a certain good. We use Balassa’s definition, which says that a place is an effective producer of a good if it produces more than its “fair share,” or a share that is at least equal to the share of total world production that the product represents (RCA greater than one). One example: in 2010, soybeans represented 0.35% of world trade with exports of $42 billion. Of this total, Brazil exported nearly $11 billion worth of soybeans. Since Brazil’s total exports for that year were $140 billion, soybeans accounted for 7.8% of Brazil’s exports. By dividing 7.8% / 0.35%, we find Brazil has an RCA of 22 in soybeans, meaning that Brazil exports 22 times its “fair share” of soybean exports so we can say that Brazil has a high revealed comparative advantage in soybeans.
Matrix Country Product (MCP)
When the RCA is greater than one, this may also be referred to as “MCP” (Matrix Country Product).
Diversity A measure of how many different types of products a place is able to make. The production of a good requires a specific set of knowhow; therefore, a place’s total diversity is another way of expressing the amount of collective knowhow held within that place.
Ubiquity Ubiquity measures the number of places that are able to make a product.
1. Executive Summary
In the thirty years that have passed since independence, Namibia has been characterized by its overreliance on its mineral resource wealth, procyclicality of macroeconomic policy, and large income disparities. After an initial decade marked by nation building and slow growth (1990-2000), the Namibian economy embarked on a rapid growth acceleration that lasted 15 years, within the context of the global commodity super cycle. Favorable terms of trade translated into an investment and export boom in the mining sector, which was amplified to the non-tradable sector of the economy through a significant public expenditure spree from 2008 onwards. Between 2000 and 2015 income and consumption per capita expanded at an average annual rate of 3.1%, poverty rates halved, and access to essential public goods expanded rapidly. As the commodity super cycle came to an end and the fiscal space was exhausted, Namibia experienced a significant reversal. Investment and exports plummeted, bringing GDP per capita to contract by 2.1% between 2015-2019. With debt-to-GDP ratios 3.5 times higher than those in 2008, the country embarked on a fiscal consolidation effort which brought the primary fiscal deficit from 6.8% of GDP in 2016 to 0.6% by March 2020. Along all these years, inequality has been endemic and is reflected across demographic characteristics and employment status. At present, a large majority of Namibians are unable to access well-paying formal sector jobs, as these tend to be particularly scarce outside of the public sector. Looking forward, the road to sustained inclusive growth and broad prosperity entails expanding the formal private labor market by diversifying the Namibian economy, while at the same time removing the barriers preventing Namibians from accessing these opportunities inherited from the apartheid.
The Growth Lab at Harvard University has partnered with the Government of Namibia to develop research that results in inputs for a policy strategy aimed at promoting sustainable and inclusive growth. The Growth Diagnostic is a cornerstone of the ongoing research engagement and is meant at providing an overview of the most binding constraints to Namibia’s economic performance and outlining how these relate in a systemic way to the concurrent challenges of growth, fiscal sustainability, and inclusion.
Inclusive growth in Namibia is currently facing a set of self-reinforcing constraints. The country is missing both the productive capabilities ( words ) and required skills ( letters) to sustain longer periods of growth. The low degree of knowhow agglomeration that can be inferred from its current productive structure – as gathered by the Economic Complexity Index (ECI) – leaves very little opportunities of diversification that can be pursued by redeploying existing skills (low connectedness). Our analysis reveals that Namibia has been able to diversify differentially more that most of its peers given its current set of productive capabilities, but the problem is that the set of adjacent opportunities are neither complex nor plenty. As the marginal cost of acquiring new capabilities tend to be high , the government needs to take a more active role in sorting coordination and information failures associated to the process of productive diversification and self-discovery.
Relatedly, Namibia’s growth prospects of are also constrained by a shortage of specialized skills. Three empirical facts derived from econometric analysis of Labor Force Survey statistics point in this direction. First, certain skill-intensive industries and occupations exhibit differentially higher wage premiums. Second, highly educated, and experienced workers face the lowest unemployment rates in
the economy, by a wide margin. Third, skill-intensive industries tend to grow less than the rest of the sectors in the economy.
The demand for high skilled foreign workers is high – as proxied by their wage premium. This skill shortage may be constraining not only existing industries but also the development of new engines of growth, limiting access to opportunity for Namibians across all skill levels. Missing skills at the top of the spectrum tends to depress job creation at the bottom. These two constraints – low knowhow agglomeration with poor connectedness and skills shortages – seem to reinforce each other. Using the Scrabble metaphor, Namibia is missing the letters (productive capabilities) and the entire words (more complex products).
Knowhow, by definition, resides in brains of people and it’s embedded in the goods and services a country produces. A broad knowhow-enhancing strategy aimed at targeting efficiency-seeking foreign direct investment (FDI, firms bringing entire new words to Namibia), and migration regulation policies (specific letters needed by more complex industries) is required to ease the binding constraints. Investment promotion efforts shall be targeted to ‘efficiency-seeking’ firms, which tend to take advantage of a competitive factor in the country (efficient labor force, access to international financial markets, infrastructure, etc.) to produce and export to foreign markets. This type of FDI is essentially different from the ‘natural resource-seeking’ investments that have characterized the Namibian economy and pose additional challenges. At the same time, the country would benefit from a more open immigration policy targeted towards high-skill workers. The evidence we have gathered suggests that high-skill foreigners tend to function as complements – rather than substitutes – to Namibian workers: industries with larger shares of high-skill workers tended to pay lower skill workers significantly higher wages. Easing the existing restrictions t labor flows and incentivizing inflows of high-skill foreigners will likely trickle down into the rest of the labor force and enhance the knowhow agglomeration of the Namibian productive ecosystem.
A challenge to productive diversification broadly, and attracting foreign investment and talent more particularly, might be policy uncertainty. Existing levels of policy uncertainty – instability or absence of the adequate regulating environment, worries about potential issues for property rights, inexperience with respect to the efficiency of domestic courts – in Namibia might not be enough to deter investments in resource-based industries, but might be an important hurdle for other type of industries, especially the ones that have a choice regarding their international location. To attract these investments, a simpler and more transparent investment environment, coped a more comprehensive set of international investment treaties, might be necessary.
The report is organized in six sections, including this Executive Summary. Section 2 outlines the Growth Diagnostic methodology. Section 3 provides a summary of the growth trajectory of Namibia and the challenges facing inclusive growth. Section 4 covers the main takeaways of the analysis conducted in each of the branches of the Growth Diagnostics Tree, including those related to access to finance, low social returns, government failures and agglomeration of collective knowhow. Section 5 concludes by highlighting potential binding and providing inputs for a collaborative exploration of why these issues have persisted and become an equilibrium.
2. Growth Diagnostic methodology This section briefly outlines the Growth Diagnostics methodology and describes the principles that underline the analysis carried out and the interpretation of outputs and findings as featured on this report. Growth Diagnostics exercises are aimed at identifying the most binding constraints to private investment and economic growth in a place, taking account of historical patterns of growth and testing all potential roadblocks at present. Since not all constraints are equally binding and both policy resources and state capacity are limited, reforms will be successful only if they address the areas with the largest potential impact in a holistic fashion.
Some of the guiding principles behind on the Growth Diagnostics include:
• Economic growth is key : Improving people’s standards of living should be the main goal of economic and social reforms enacted by governments. In some places, economic growth may be sluggish, unsustainable, or inequitable. Understanding a place’s specific growth problem is important, but in any case, standards of living cannot sustainably improve if the economy does not expand.
• Adequate prioritization: A long list of structural reforms is rarely of much use for governments, particularly given the administrative, political, and budgetary restrictions they face. Growth Diagnostics prioritizes interventions by impact and therefore produce the biggest bang for the reform buck.
• Focus on local problems: Reforms based on one-size-fits-all approaches or on international best practices have a high probability of failure. The Growth Diagnostic methodology is an approach that combines a wide array of aspects of economic theory and empirics and deploys them to the specifics of the country context, rather than blindly applying a given theory or set of models over another.
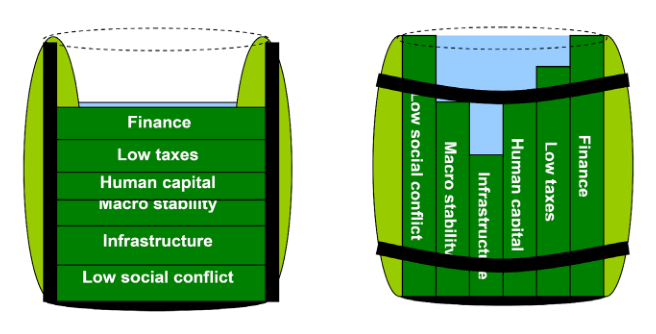
In identifying which of the many possible elements of an economy is constraining, the framework recognizes that factors that influence growth are complements rather than substitutes. The contrast can be visualized by through the structure of the two barrels in Figure 1. The left-hand barrel has horizontal wood slabs, while the right-hand side barrel has vertical slabs. The volume in the first barrel depends on the sum of the width of all slabs, consistent with the notion of substitutes. Increasing the height of any slab will increase the volume of the barrel. The volume in the second barrel is constrained by the length of the shortest slab. The impact of a change in a slab on the volume of this barrel depends on whether it is the binding slab (constraint) or not. If it’s not binding, the impact is negligible. In general, economies tend to be like the second barrel.
Figure 1: Determinants of Adequate Growth – Complements or Substitutes?
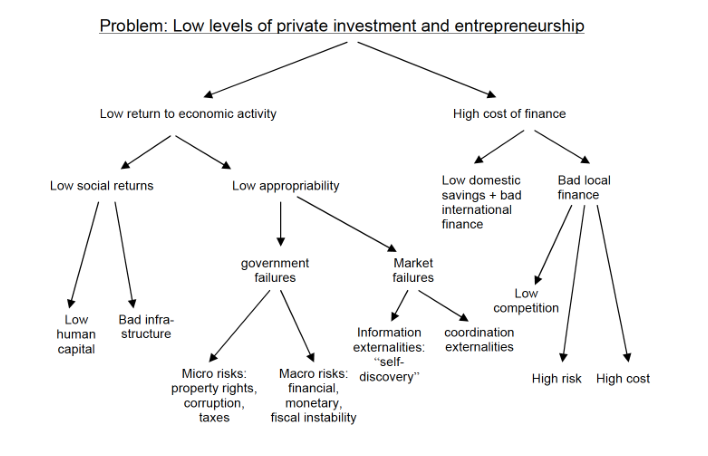
To identify the most relevant restrictions (the shortest slabs), the methodology hinges on a number of diagnostic tests applied from top to bottom on a Growth Diagnostic Tree (Figure 2). The tree is meant to be instructive, helping to organize the issues potentially constraining private investment and economic growth in an economy. It shall not be considered exhaustive or complete, as each context might have its own sets of particular issues that shall be tested to evaluate if they are binding a better growth process. To go down the diagnostic tree, we start by asking why we observe low levels of investment and entrepreneurship. From there, moving downwards, the decision tree breaks into issues constraining productivity (left hand side) or finance (right hand side). Is there low productivity or returns to economic activity or are returns high, but access to finance is prohibitive? In turn, low productivity or returns to economic activity can be broken into low social returns (driven by low human capital or insufficient infrastructure) or low appropriability (government and collective knowhow failures). At each point, depending on which branch more closely described the constraints in that particular place, the diagnosis tree outlines possible areas to test further.
To test for the most binding constraint down the tree, the Growth Diagnostics framework uses four principles of differential diagnosis:
• The shadow price is too high: A high “shadow price” indicates the relative scarcity of a factor in the economy. The “shadow price” test should seek to complement measuring scarcity via quantity , since low availability alone can be a signal of either low supply of something or low demand for it. Some inputs to production have a market price that can be measured, but certain factors face price controls or lack explicit prices. Hence, the definition of “shadow prices” may extend to the cost of safeguarding access to the factor or to the losses faced for lack of appropriate access to the factor.
• Movements in the constraint shall produce movements in the objective function: By definition, if a binding constraint is relaxed this should increase the value of the objective function. In the context of growth diagnostics, if a particular constraint is relaxed, there should be an associated payoff in terms of growth, investment, job creation, or whatever the specific
economic objective is. Similarly, if a particular constraint is tightened then we should observe a deterioration of the objective function. However, it should be noted that for many factors the relevant statistics are not updated as frequently as the objective variables, hence it is not always possible to adequately pursue this test.
• Agents in the economy should be attempting to overcome or bypass the constraint : Local stakeholder actions signal the constraints holding back economic progress, even if those constraints may not be vocalized. If relevant local agents are observed attempting to overcome a particular problem related to a factor in the diagnostic tree, it may be a signal that the factor is a binding constraint to the economy as a whole. For example, if firms are investing heavily in the capacity to pump water, this is a signal that water may be a constraint to production. This type of test generally requires complementing quantitative analysis with carefully considered qualitative analysis, as standard statistical tools may not be geared at identifying the nature and frequency of these trends.
• Agents less intensive in a binding constraint should be more likely to thrive (and vice versa ): Looking at the nature of the most successful sectors in a place can be informative of the constraints. Sectors that tend to be less intensive in the constrained factor shall be doing comparatively well and be more prevalent within the structure of the economy. Conversely, those sectors most intensive in the constraint should be doing relatively poorly or be less prevalent. For example, if electricity is a binding constraint, one would see that the sectors of the economy that are more electricity-intensive factor (manufacturing) might struggle in comparison to sectors that are less intensive in the use of electricity (financial services).
Figure 2: A Growth Diagnostics Tree
The Growth Diagnostics methodology is a means of organizing an investigation into what holds an economy back from better growth performance and, ultimately, slower improvement in living standards. It allows for the use of many economic disciplines and tools in a practical and place-focused way. For some economies, it is useful to work explicitly through the entire diagnosis tree to test competing theories for what is holding its economic potential. The process allows for a focus on evidence rather than instincts and can help policymakers focus scarce resource – including human resources – on solving problems most critical to growth that may have been poorly understood prior to the exercise. It is sometimes the case that multiple constraints are critical and that the underlying forces that have allowed these constraints to fester are deeply related.
Once the most binding constraints have been identified, the Growth Diagnostic exercise should focus on explaining why these issues have persisted and become an equilibrium. Reaching this level of understanding entails elaborating further hypotheses and testing their implications and how these different constraints interact. That is fertile ground for active collaboration with domestic stakeholders and technical subject matter experts. The result should be a process of collective thinking that is both dynamic and iterative, strengthens the robustness of the analyses and gradually narrows the set of relevant hypotheses. That process may require multiple iterations until an acceptable level of convergence towards a consistent hypothesis is reached.
As is the case in medicine, where diagnostic tools are used to identify a syndrome that can then be cured through a holistic internally coherent treatment plan that attacks the disease (and just the symptoms), the findings from this report could be leveraged to outline a treatment plan for the economic syndrome of Namibia. This would be the focus of forthcoming reports and other applied research work.
3. Summary of findings of Namibia’s Growth Trajectory
This section summarizes the trajectory of Namibia’s economy, identifies limitations to the nature of growth, and characterizes a set of self-reinforcing challenges that the country faces as it continues to pursue sustainable and inclusive growth.
Growth trajectory A generation into independence, Namibia displays significant progress towards long-term development. The country has made strides in overcoming a legacy of exclusion, biases in the development of state capabilities and access to public goods. Namibia has also established public institutions that increased civic engagement and participation; and achieved significant socio-political stability.
Economic growth had been modest until the 21st century, but between 2000-2015, Namibia embarked upon a rapid growth acceleration, outperforming its African peers. 1 During these fifteen years, poverty rates halved, and Namibia closed its income gap with South Africa by 45%, going from an income gap of 36% in 2000 to 20% in 2015.
The growth acceleration was driven by the global commodity super cycle – which translated into favorable terms of trade, an investment boom in the mining industry, and exports coming from that sector. Starting in 2008, a rapid expansion in public expenditure fueled the growth acceleration further, transmitting and amplifying the impacts of the commodity-driven boom to the rest of the economy. The result was a large multiplier effect on the non-tradeable sector, which contributed to the vast majority of growth during this expansion.
By 2015, many of the factors behind the acceleration started to wane. Investment plummeted, going from 35% of GDP in 2014 to 15% in 2017 and close to 10% in 2019. Exports fell by 20% between 2014-2017. Ensuing deficits pushed Namibia to focus on fiscal consolidation efforts. Output in the mining sector continued to rise, but from an aggregate demand perspective, the fall in investment and the fiscal contraction resulted in the non-tradeable sector entering a recession.
From a standpoint of economic growth, the reversal of trends was remarkable. Gross domestic product, which had increased at an average rate of 4.8% over the fifteen years of the growth acceleration (2000-2015), contracted at a compounded average rate of 0.2% between 2015-2019. That swing heightens when we look at GDP per capita; Namibia went from growing at 3.1% on average over the expansion to contracting by 2.1% on average between 2015-2019 – a total loss of 8.1% in income per capita in just four years.
Three overarching challenges faced by Namibia By the beginning of 2020, Namibia was already facing three concurrent challenges: reigniting economic growth, consolidating its fiscal balance, and promoting equal opportunities for all its citizens. Onto this stage came the global pandemic of COVID-19, which only amplified these challenges.
Namibia’s growth prospects have historically been characterized and conditioned by its reliance on mineral resource wealth, low productivity outside the mining sector, and difficulties in diversifying due to the low agglomeration of productive capacities and knowhow in the economy. Engineering a growth-friendly fiscal adjustment implies grappling with the joint tasks of mobilizing domestic revenues and optimizing public expenditure. There are several underlying factors behind inequality in Namibia. On the one hand, background and demographic characteristics are proximate causes for income inequality. On the other hand, limited access to quality jobs can further explain gaps in observed outcomes.
From this analysis, it is possible to outline a series of policy pillars to attempt to address these challenges in an internally coherent and holistic manner. The growth agenda should include a dual focus, helping Namibia make the most out of its natural resources, while at the same time exploring possibilities to expand into more complex economic activities. That should gradually increase the stock of knowhow, allowing for higher productivity, export diversification, and job creation. With regards to fiscal sustainability, it should purport both an efficient prioritization of public capital expenditures and wage bill reforms that are viable and go hand-in-hand with private sector job creation. With regards to inclusion, a comprehensive agenda should go beyond initiatives to compensate for low productivity and should stress opportunities for Namibians to join formal economic activities of higher productivity. Likewise, they should also foster policies aimed at addressing the factors that prevent Namibians from accessing jobs in high productivity sectors in the first place.
This Growth Diagnostic Report seeks to build upon these findings by attempting to tease out factors constraining investment and sustainable and inclusive growth, identify further underlying causes behind the challenges of structural transformation, fiscal sustainability, and inclusion and, eventually, put forth further insights to complement and amplify the preliminary policy pillars.
4. Growth Diagnostic Analysis This section covers four potential areas of binding constraints: access to finance, low social returns, government failures and collective knowhow agglomeration 4.1 Access to finance Access to finance becomes a binding constraint when projects with high risk-adjusted returns are not undertaken due to an inability to access finance. The challenge lies in disentangling if the observed outcome (low private investment) is driven by a situation where there are numerous profitable projects that are lacking finance, or by one where there is finance available but not enough profitable projects.
Broadly speaking, there are three different reasons that can lead to low availability of funds to undertake investment projects. The first one is related to savings. Given that financial markets intermediate between those with excess funds and those with ideas or entrepreneurs, one potential reason for finance to be a constraint is low levels of domestic savings relative to the demand for investment credit. The second reason has to do with access to international markets: even if domestic savings are low, profitable projects can tap into foreign savings by means of foreign direct investment (FDI) or via international financial markets. The third reason is related to poor financial intermediation. Even if domestic savings are high, funds available to investors might be restricted by inefficiencies in financial intermediation.
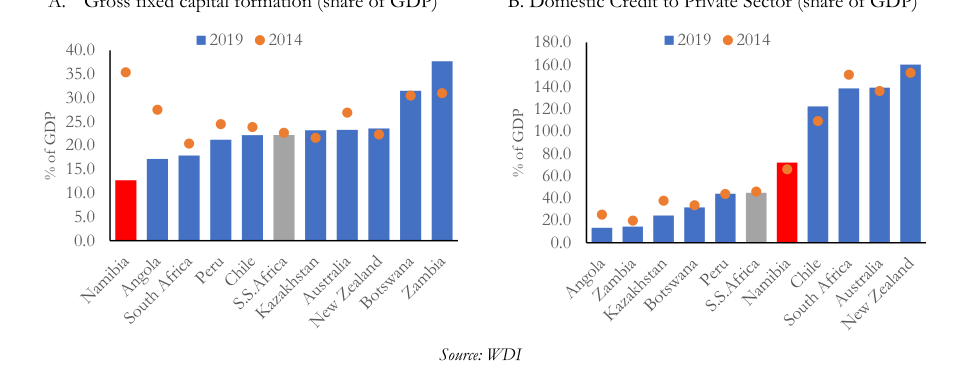
Gross formation of fixed capital and credit to the private sector Namibia Over the five years that span between 2014 and 2019 Namibia’s gross formation of fixed capital (investment) as a share of GDP went from first (35%) to last (13%) among all regional and international peers (Figure 3, Panel A). At the same time, the country’s levels of domestic credit to the private sector – 66% in 2014 and 72% in 2019 – ranked near the median of the benchmark countries and significantly higher than the average of Sub-Saharan Africa (Figure 3, Panel B). These trajectories are not necessarily at odds, as they might result from a combination of a recession driven by a plummeting of private investment (domestic or foreign) and a steady portfolio of non-productive credit becoming higher as a share of GDP.
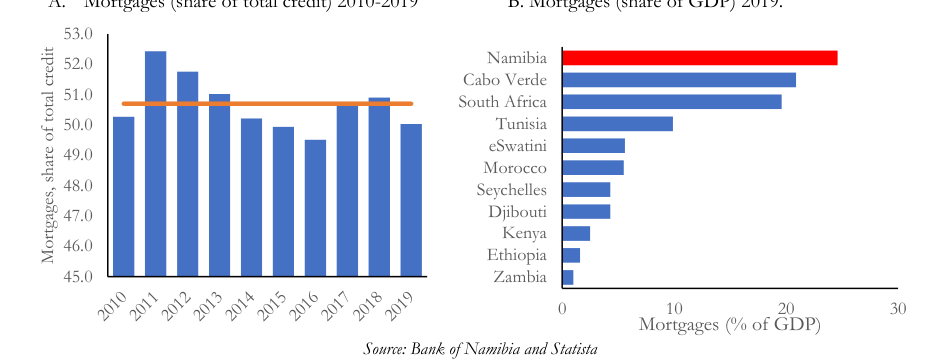
The evidence coming from the real estate market provides some ground to this hypothesis. By 2019 the composition of Namibian banking credit was highly concentrated in mortgages (50%), followed by commercial credit (40%) and other types of household credit (10%). 2 The exposure to the mortgage sector as a share of total credit is well above benchmark peers like Chile (31%), South Africa (18%), Botswana (17%), and Peru (16%). The fact that the weight of mortgages within the domestic credit portfolio has remained relatively stable over the previous decade (50.7% average between 2010-2019, Figure 4, Panel A), signals that the investment collapse was driven by a fall of foreign direct investment (FDI) rather than in productive credit. Given that FDI is sourced out of other countries’ savings, its plunging would not affect the size and composition of the domestic credit portfolio – as portrayed in Figure 4. The recession driven by the negative FDI shock coupled with the large exposure of long-
term credit to real state, has propelled the size of mortgages as a share of GDP to be the largest in Africa (Figure 4, Panel B).
Figure 3: Gross Formation of Fixed Capital and Credit to the Private Sector
A. Gross fixed capital formation (share of GDP) B. Domestic Credit to Private Sector (share of GDP)
The high allocation of credit to the mortgage sector relative to peers could also be driven by different factors, such as low demand for productive credit or a boom in the real estate market potentially crowding out investment from more productive uses. The fact that the higher share of mortgage credit has remained constant for a decade suggests that the latter is unlikely, but a look at the evolution of domestic savings and the price of credit (interest rates) might provide more definitive evidence.
Figure 4: Mortgages in Namibia
A. Mortgages (share of total credit) 2010-2019 B. Mortgages (share of GDP) 2019.
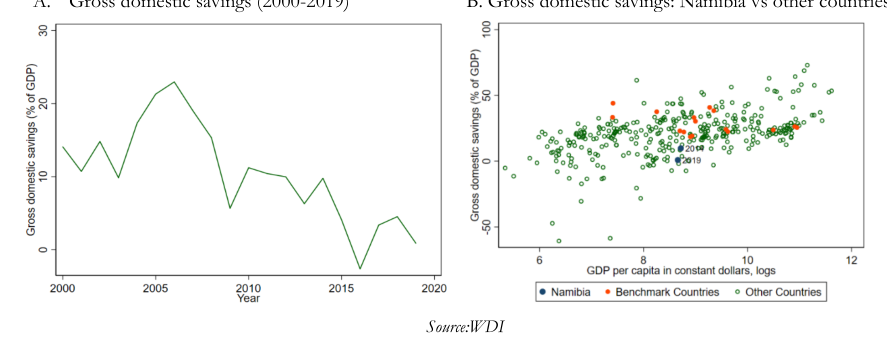
Domestic savings and access to international finance Domestic savings in Namibia have plummeted over the previous 15 years (Figure 5, Panel A). Even without considering the peak registered in 2006 (22% of GDP), by 2019 savings as a share of GDP had fallen to one-tenth of their 2000-2015 average. Over the previous five years (2014-2019), Namibia’s savings rates have been the lowest among its regional and international peers, and close to the lowest in the world for its level of income per capita (Figure 5, Panel B).
Figure 5: Savings in Namibia
A. Gross domestic savings (2000-2019) B. Gross domestic savings: Namibia vs other countries
Low levels of domestic savings do not necessarily imply that access to finance is constraining private investment. First, even within a context of low domestic savings, access to finance will only become a constraint when they are met by a high demand for investment credit. Second, even in the latter case, finance would not be a constraint if profitable investment projects can tap international savings, by means of foreign direct investment or by resorting to global financial markets. In both cases, the answer lies in prices: Real interest rates in the domestic market and Namibia’s sovereign risk premium in international financial markets.
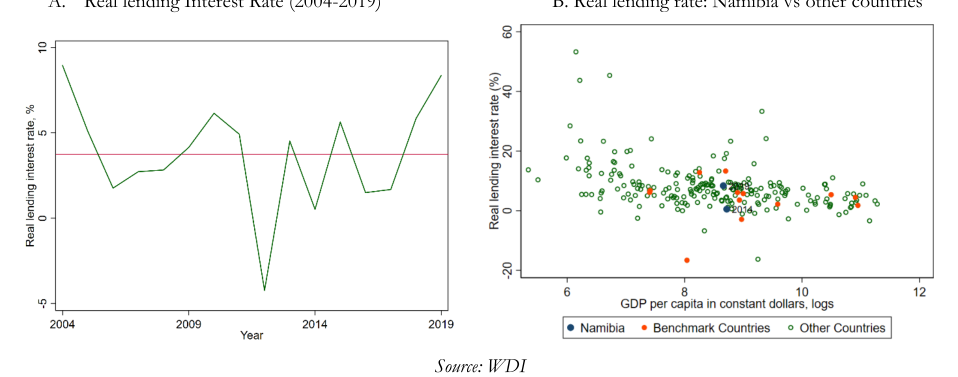
Access to credit: Price indicators The real lending interest rate in Namibia averaged 3.8% in 15 years spanning from 2004-2019 (Figure 6, Panel A). Although the trajectory has been somewhat volatile, the real lending rate level is similar to those observed in benchmark peers and is by no means an outlier when compared with countries with a similar income level (Figure 6, Panel B). Within a context of low domestic savings, lower relative interest rates suggest that the demand for investment credit is also low, potentially constrained by other factors rather than access to credit.
Figure 6: Real lending rate
A. Real lending Interest Rate (2004-2019) B. Real lending rate: Namibia vs other countries
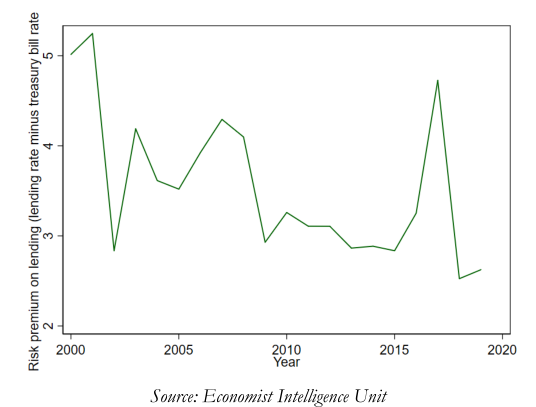
Source: WDI Another condition for access to finance to be a binding constraint is lack of access to international finance. Difficulties in accessing international financial markets usually manifests in large sovereign risk premiums. In the case of Namibia, the country has been enjoying access to external finance at a low and even decreasing rates (Figure 7). The only hiccup in this trend occurred after Namibia lost investment grade rating in 2017, but since then sovereign risk premia continued to fall amidst declining rates in financial markets and ample international liquidity.
Figure 7: Namibia sovereign risk premium
Source: Economist Intelligence Unit
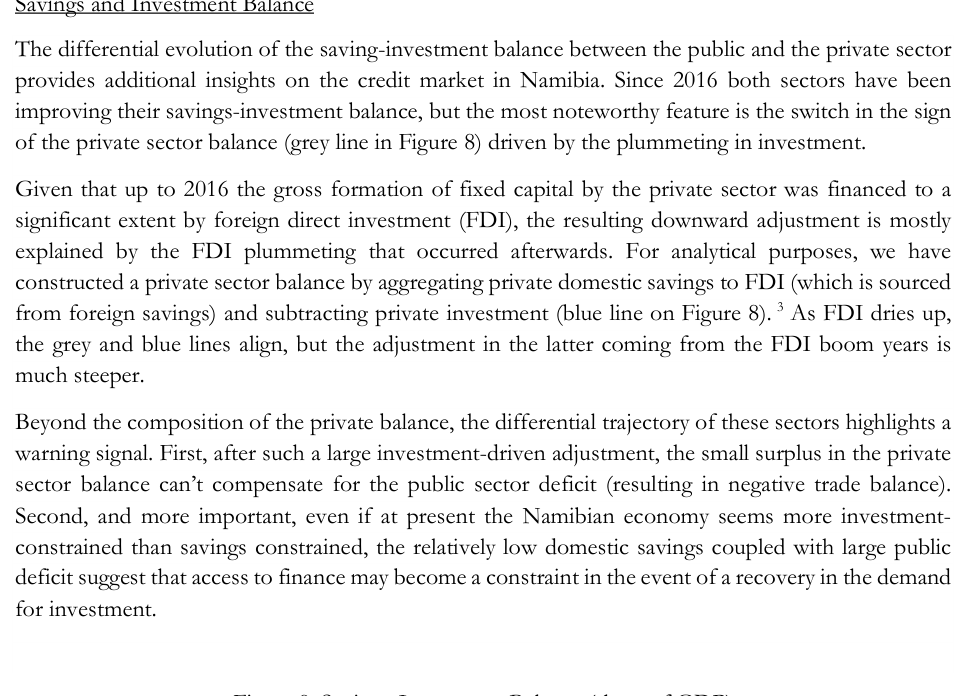
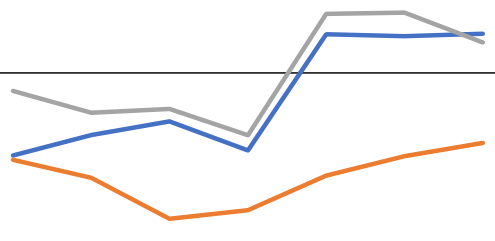
Savings and Investment Balance
Source: Namibia Statistics Agency
Financial Intermediation in Namibia Another factor that might potentially restrict access to credit is poor financial intermediation. Namibia’s banking sector is comprised of eight banks: seven commercial banks and a branch of a foreign banking institution. By 2019 total assets in the banking system were around 80% of GDP (142 million Namibian dollars), up from an average of 70% of GDP a decade earlier. The three main commercial banks (2 South African and 1 Namibian) concentrate roughly two thirds of total banks’ assets. Loans represent 78% of bank assets, out of which roughly half – as stated earlier – are directed to residential and commercial mortgages.
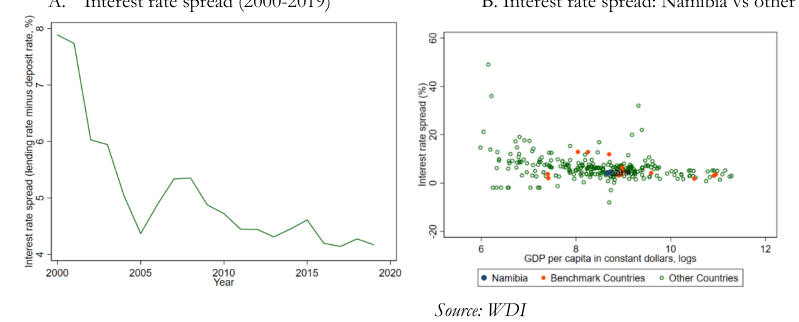
Namibia also has a large Non-Bank Financial Institutions (NBFIs) sector with assets that are equivalent to 177% of GDP. NBFIs assets are primarily held by Pension funds (55%), Insurance companies (21%), and Collective investment schemes (19%). Micro-lending institutions, Medical aid funds, and other institutions hold the remaining 5% of assets. Access to credit does not seem to be restricted by inefficiencies in financial intermediation. The spread between deposit and lending rates has been decreasing over time and by 2019 was at its twenty-year minimum (Figure 9, Panel A). The spread is also on the lower end of the spectrum when compared to regional and international peers, and about the median one would expect given Namibia’s income per capita.
Figure 9: Interest rate spread (lending minus deposit rate)
A. Interest rate spread (2000-2019) B. Interest rate spread: Namibia vs other countries
Source: WDI Firms’ perception on access to credit In spite of the lack of evidence supporting access to finance as a constraint, nearly 50% of Namibian businesses identified access to finance as their biggest obstacle in the 2014 Enterprise Survey of the World Bank (Figure 10). 4 That perception seems to be driven by small and medium-sized firms (SMEs), as 53% of small firms and 33% of medium firms considered access to finance (or the lack thereof) as their biggest obstacle in doing business in Namibia. In contrast, only 6% of large firms (100+ employees) mentioned access to finance as their major concern.
Figure 10: Main obstacles for firms’ growth
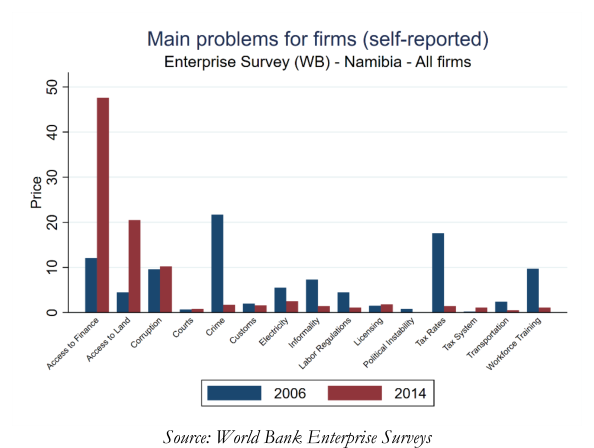
Source: World Bank Enterprise Surveys Lack of access to credit for SMEs also came up often in the interviews of the Growth Lab team with banking institutions. Most interviewees confirmed that loans to SMEs were not a significant part of their lending portfolio and were not considered a priority given risks and challenges in enforceability. There were also mentions to various efforts carried in the past to enable credit to SMEs through public interventions, with mixed results. Just as for the economy as a whole, access to credit to SMEs would only be considered a binding constraint in case there are numerous profitable projects – from a riskadjusted standpoint – that are not undertaken due to lack of financing. Another hypothesis is that low credit to SMEs is a consequence of low productivity or risk-adjusted returns that are not able to compensate the cost of capital. The empirical evidence analyzed suggests that at present the Namibian economy is investment-constrained, rather than finance-constrained. Namibia’s levels of domestic savings are low, but they seem to be enough to cover meager demand for investment credit. In that context, the government has been increasingly resorting to the domestic market to finance its persistent public deficits. While at present the public deficit is not crowding out the private sector, that situation can change in the event of an economic recovery and a resumption of the demand for investment credit. In that case, competition for a small pool of domestic savings might lead to a situation where either to government or the public sector are constrained by access to finance.
4.2 Low social returns This section of the analysis covers low social returns as a binding constraint. The focus of this section is to understand whether potentially viable investments are not being carried out because the actual returns are just low, even if appropriable. The causes for low social returns are potentially many, but they typically involve some missing complementary factors or inputs that an individual investor cannot provide. This area of the analysis touches upon human capital, logistics and infrastructure, water, electricity, and land.
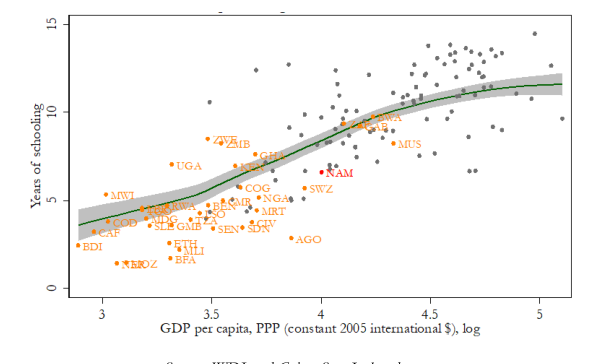
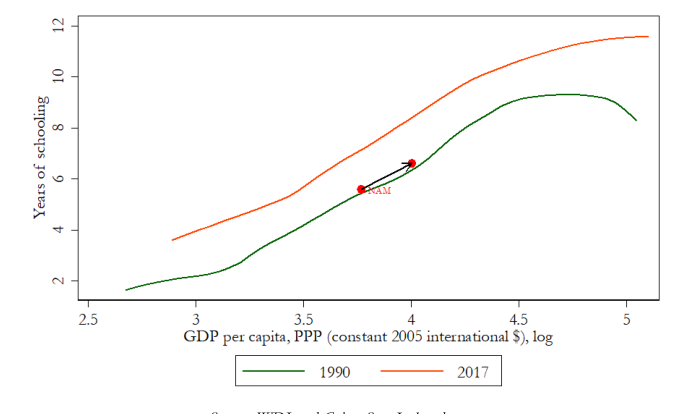
4.2.1 Human Capital In assessing human capital as a potential constraint, it is key to determine if the skills spectrum of the country is sufficient for competitive firms to engage in productive activities. At an individual level, we will define human capital as the acquisition of knowledge and skills through education, training and experience mostly by adding both physical and cognitive capabilities that will allow individuals to increase the marginal productivity of efforts. 5 At an aggregate level, countries with an adequate supply of human capital will have the necessary stock and spectrum of skills available for firms to engage in economic activities competitively, allowing them to adopt new technologies in the production and rendering of new goods and services. For the purpose of this section, human capital will be considered a binding constraint if the country’s stock of skills is inadequate to pursue these goals – thus the quality and quantity of skills cannot meet the demand – or there is a misallocation of skills. 6 Availability of educated workers Educational attainment in Namibia is low for its level of GDP per capita. Compared with global averages, the country has lower levels of educational attainment than would be expected given its per capita GDP (Figure 11). While educational attainment has increased in the past three decades, the country has lagged the rest of the world in both levels and the rhythm of progress that has been made (Figure 12).
Figure 11: Years of Schooling, 2017 – Population Aged 25 and above, Namibia
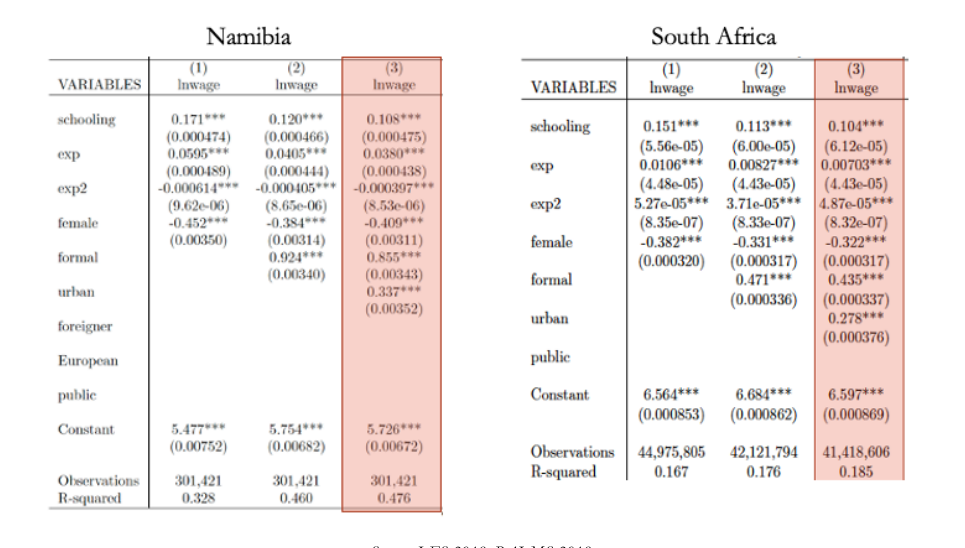
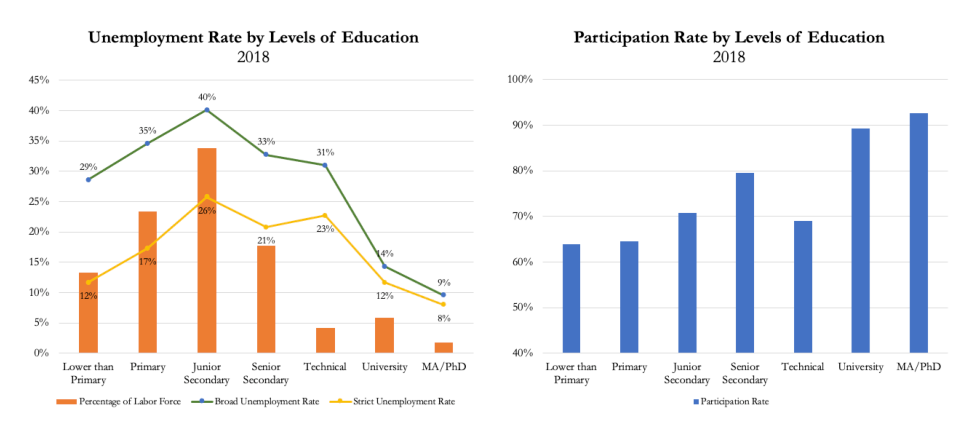
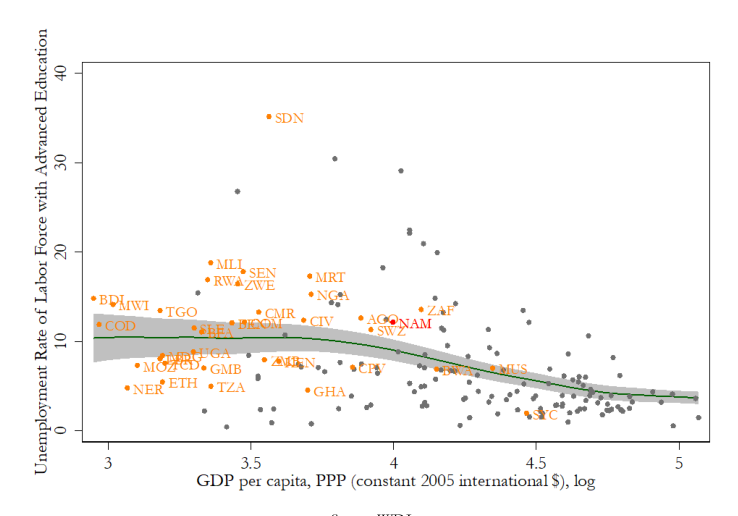
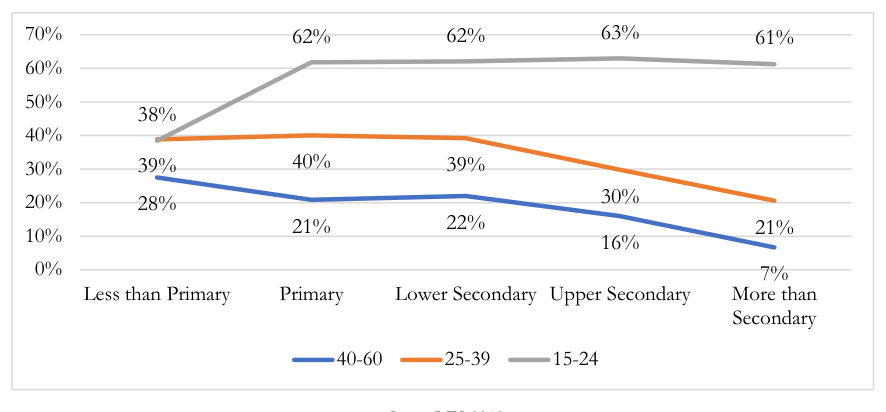
On average, Namibia’s low educational attainment appears to be fueled primarily by relatively low demand for educated workers: education without experience doesn’t seem to improve employability prospects. When looking at private sector returns to education, regression analysis shows that after controlling for background and demographic characteristics like experience, gender, formality, and urban location, returns to schooling in the private sector 7 in Namibia are 10.8%, consistent with both global averages of ~9% and with the South African premium of 10.4% (Figure 13). 8 Despite the fact that unemployment rates decrease and participation rates increase with level of education, the unemployment rates for the most educated are amongst the highest in the world for Namibia’s level of income (Figure 14 & Figure 15). 9 Furthermore, if we analyze the unemployment rate by experience cohorts, we find that unemployment rates fall drastically when we observe experienced vs. inexperienced workers – using age as a proxy – but for the most inexperienced workers the unemployment rate is essentially the same regardless the level of education attained (Figure 16). These results suggest that education alone might be less valuable – in terms of employability – than experience.
Figure 13: Returns to Education in the Private Sector, Namibia and South Africa
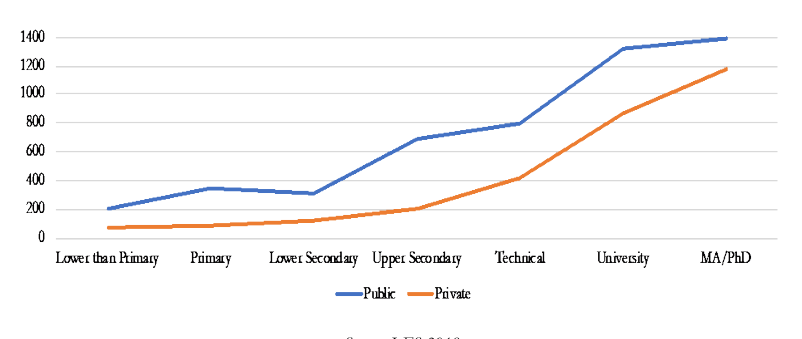
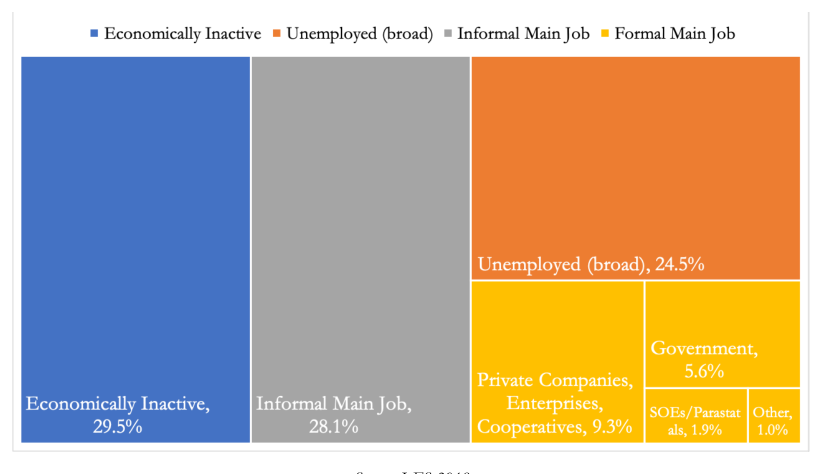
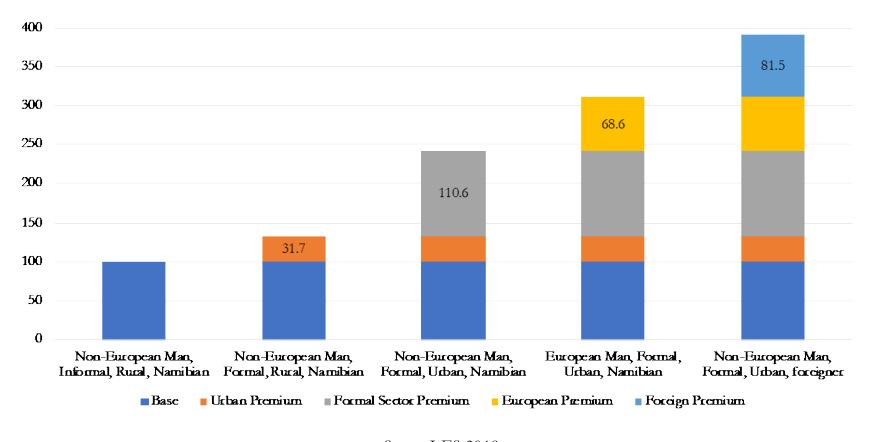
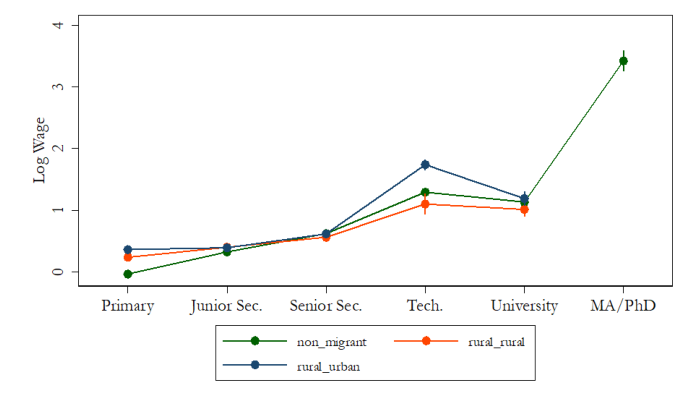
Opportunities are primarily concentrated in the urban formal sector, but more education on its own is unlikely to unlock these opportunities for a large number of Namibians. For the majority of nonforeign and non-European language speakers Namibians, the formal sector and urban location premium are large; combining the two premia indicates that being employed in the formal urban sector pays nearly 150% more than being employed in informal rural jobs (Figure 19). However, accessing these ladders of opportunity entail overcoming significant structural barriers. The most significant explanatory factors of the likelihood of being employed in the private formal sector is living in an
urban area. In turn, the most significant explanatory variable for the likelihood of living in an urban area is the language spoken by the worker – which could be operating as a proxy for other unobserved variables highly correlated with language. In both instances, the positive contributions of education are not sufficient – on its own – to overcome the structural barriers (Figure 20).
Figure 19: Private Sector Wage Decomposition
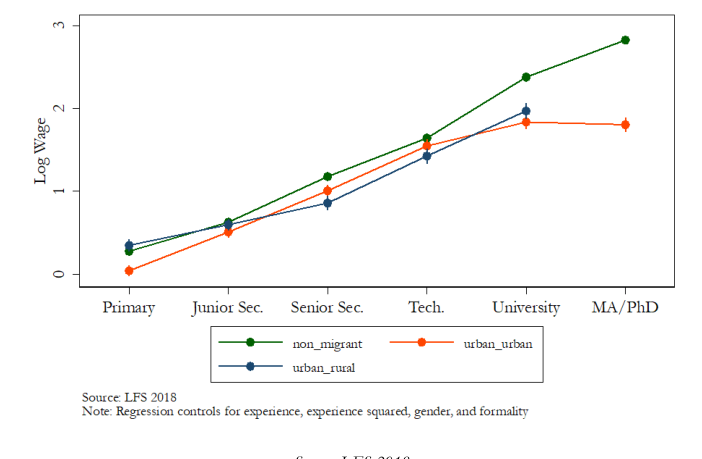
Overall, the evidence suggests that the educational attainment of Namibia’s workforce does not appear to be a binding constraint for the existing engines of growth. Namibia was able to grow at a high pace for more than a decade (2003-2014) without a concurrent increase in education, which suggests that educational attainment (or the lack thereof) did not constrain the performance of existing engines of growth. Overall returns to education in the private sector are not differentially higher and increasing years of schooling alone does not seem to unlock significant labor market opportunities or open access to better jobs.
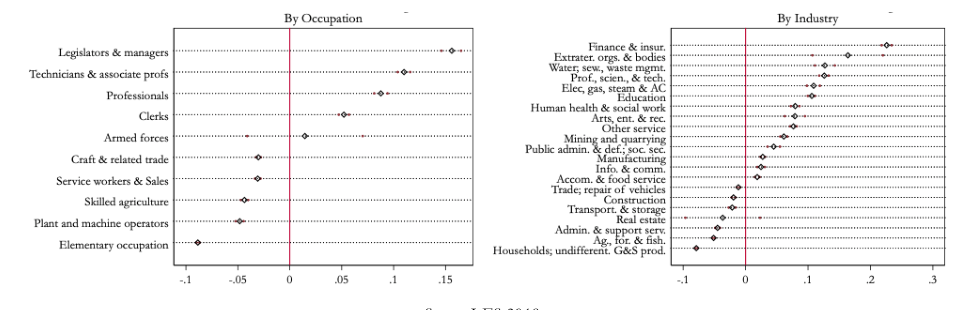
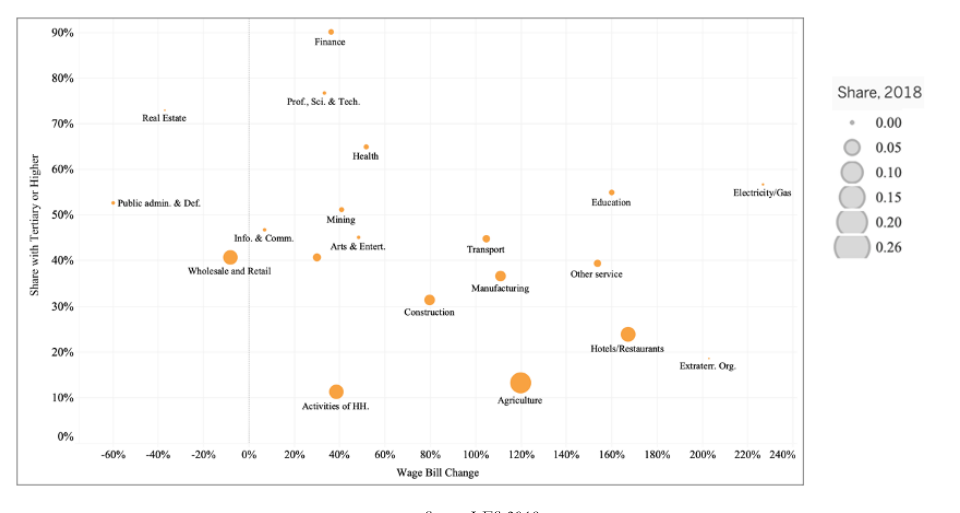
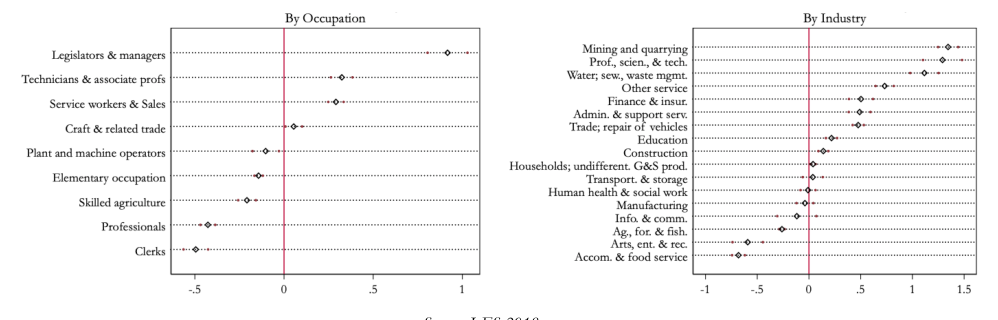
Availability of workers with specialized skills While schooling doesn’t seem to be binding, the availability of specialized skills – especially the type of knowhow gained through learning by doing – may pose a challenge to growth of certain industries. As noted above, unemployment rates are high across all levels of education, but fall drastically for those with experience. Moreover, it is the highly educated experienced workers who have by far the lowest unemployment, suggesting that a combination of advanced training and on-the-job skills are in particularly high demand (Figure 16). We also observe that specific occupations (e.g.: managers, professionals, and technicians) and industries (e.g. finance and insurance, professional, scientific, and technical) earn differentially high wage premia even after controlling for personal and demographic characteristics, suggesting that specialized workers are scarce and therefore employers must pay dearly for them (Figure 21). Likewise, industries that are intensive in skilled workers 10 have grown on
average 11 less than those that are not, suggesting that the relative scarcity of certain high skill workers may be constraining their growth (Figure 22).
Figure 21: Differential Returns to Schooling by Occupation and Industry
Wage premia for high-skill foreign workers can be very high, further emphasizing the existence of skills shortages. Analysis of foreign workers in Namibia indicate that foreigners are divided into high skill professionals (mainly from Europe and South Africa) and lower skill workers (mainly from neighboring countries), 12 which are somewhat self-segmented into different types of occupations (Figure 23 & Figure 24). This feature is also reflected in differential wage premia to foreigners. Foreigners engaged in less specialized occupations exhibit negative wage premia, while those in managerial positions can earn 100% more than Namibians in the same positions with comparable observable characteristics. Similarly, foreigners participating in industries such as accommodation and restaurants, display significant negative wage premia, while those in the Professional, Science and Technology sector can earn over 100% more than comparable Namibians working in the same industry (Figure 25).
Figure 23: Private Sector Occupational Breakdown by Skill Level and Origin, 2018
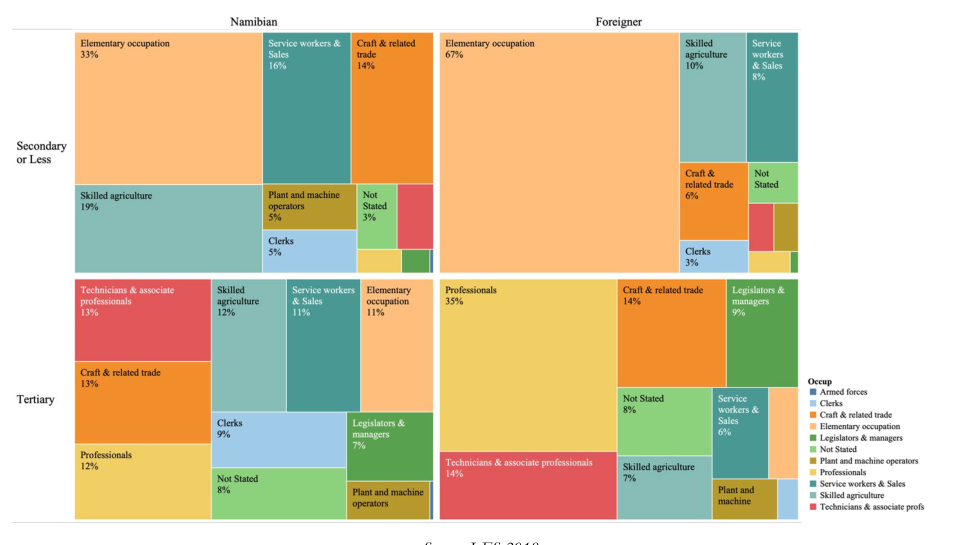
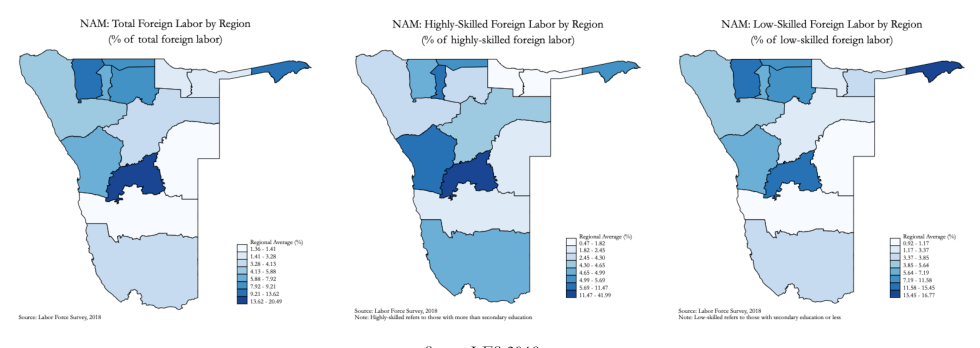
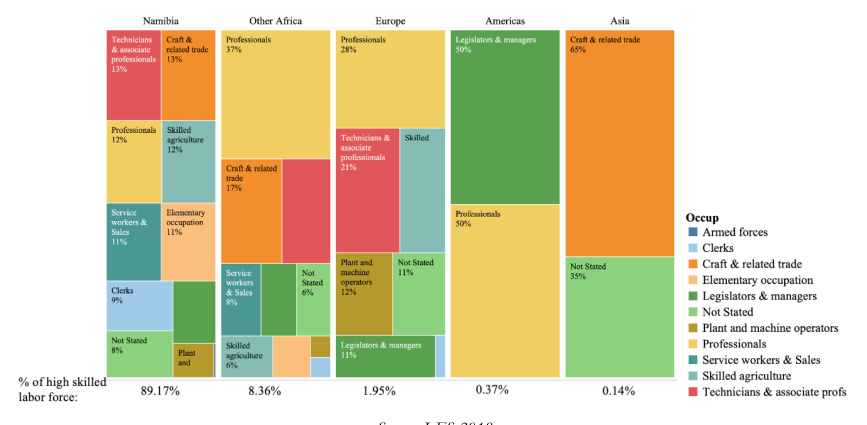
High-skill foreign workers are likely to serve as complements to high-skill Namibian workers. It is noteworthy that highly skilled foreigners tend to be employed in different occupations than highly skilled Namibians. In particular, foreigners with European backgrounds are more likely to occupy high skill professions, suggesting that these foreigners may supply differential skills that are not available locally (Figure 26 & Figure 27). 13 This suggests that high skill foreign workers are more likely to complement high skill Namibians than to substitute them.
Figure 26: Private Sector Occupation Breakdown, High Skill Workers by Origin, 2018
Tertiary RCA (calculated vis a vis lowand mid- Tertiary RCA (calculated vis a Occupation Skilled Foreigner RCA vis all workers)
skill workers)
Legislators & Managers 1.26 4.91 9.34 Professionals 2.43 5.43 11.79 Technicians & associate professionals 1.06 3.44 4.89 Clerks 0.13 1.60 1.73 Service workers & Sales 0.56 0.73 0.71 Skilled agriculture 0.63 0.62 0.59 Craft & related trade 1.06 0.93 0.92 Plant and machine operators 0.84 0.77 0.75 Elementary occupations 0.31 0.32 0.30 Armed forces – 1.51 1.61 Not Stated 0.93 2.28 2.70
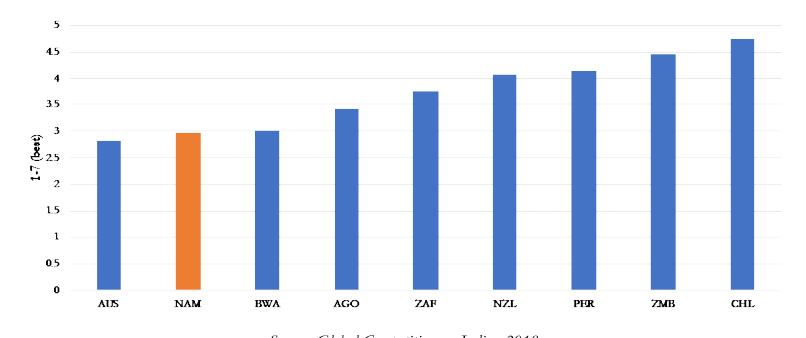
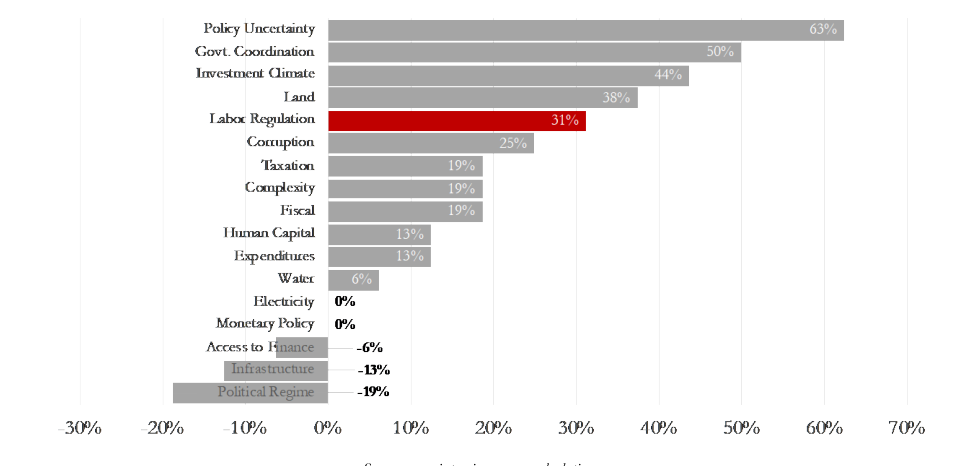
Challenges in accessing specialized knowhow are exacerbated by the difficulties of hiring and retaining foreign labor, especially for skill-intensive industries. Out of international and regional peers, Namibia ranks poorly on indices measuring the ease of hiring foreign labor (Figure 28). According to Namibian law, foreigners must obtain a work visa in order to be legally employed in Namibia for periods longer than six months, and these work visas typically take between three and six months to process and last for only one to three years, among additional requirements. According to a report published in 2014, the Namibian Business and Investment Climate Surveys in both 2009 and 2013 found that while a shortage of skilled labor prevented growth in medium and large enterprises, issues with obtaining foreign work permits was the biggest regulation challenge faced by the private sector. 14 In addition, issues with hiring foreign labor were highlighted both by a recent Bank of Namibia report 15 and in qualitative interviews with stakeholders on the ground, in which labor regulations associated with hiring foreign labor were among the most salient constraints mentioned by private sector actors (Figure 29).
Figure 28: Ease of Hiring Foreign Labor
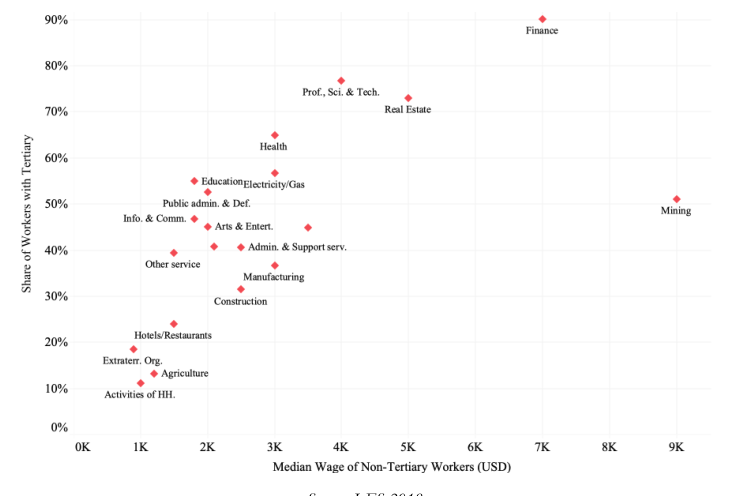
Constraints to firms hiring high skill workers has non-negligible trickle-down effects, given complementarities between higher and lower skill workers. In 2018, industries with a large share of high skill workers tended to pay low skill workers significantly higher wages (Figure 27). Additionally, high-skill workers and low to mid-skill workers tend to specialize in different types of occupations (Figure 30). 16 This evidence suggests that high skill workers are complements to lower skill workers. Thus, Namibian workers at all education levels stand to benefit from a policy aimed at addressing shortages in the supply of specific specialized skills.
Figure 30: Median Wage for Non-Tertiary Workers by Sector Skill Intensity
In conclusion, while the type of human capital that is learned at school does not seem to be a binding constraint, the evidence suggests that the growth prospects of Namibia are constrained by a shortage of specialized skills and know-how. Policies aimed at addressing that shortage are likely to unleash new opportunities in the formal labor market – more jobs and better wages – for both skilled and non-skilled domestic workers and industries. Labor Force data analysis suggest that certain skillintensive industries and occupations exhibit differentially higher wage premiums. Similarly, highly educated experienced workers face by far the lowest unemployment rates. In addition, we observe that the demand for high skilled foreign workers is extremely high – as proxied by their wage premium – and they seem to function as complements to Namibian workers, supplying skills and experience not readily available in the local labor market. At last, industries that are more intensive in these types of skilled workers have tended to grow less. All this evidence suggests that Namibia is suffering from a skill shortage, which may be constraining the development of new engines of growth and limiting access to opportunity for Namibians across all skill levels.
4.2.2 Logistics After achieving Independence in 1990, Namibia carried with it a legacy of spatial inequities on several fronts, including the provision of public goods and services. The notable exception to this is the quality and connectivity of the country’s transportation infrastructure, which was prioritized and invested in from the very beginning. Given that Namibia is a sparsely populated state, infrastructure and
connectedness is of paramount importance to economic activity and overall output. This is true across several industries that depend on an extensive and well-maintained logistics sector: mining, agriculture, manufacturing, tourism, and several others. Namibia ranks as the second least densely populated country in the world; therefore, in order to facilitate the efficient movement of goods and people across and within its borders, Namibia relies on a relatively robust transportation network. Successive governments and administrations have emphasized the importance of infrastructure investment by prioritizing it in the National Development Plans (released through the 2010s). Specifically, there has been a concerted push to position the country as a regional logistics hub of the South African Development Community (SADC). Public investment in infrastructure was a significant driver of capital accumulation and growth since Independence. 17 This included, but was not limited to, investments into the road network, the ports, airports, the rail lines, and IT & telecommunication hardware. Today, the logistics sector includes mostly public enterprises, and a few private players as well.
The logistics sector contributed roughly 15% to overall GDP in 2018, 18 a significant share when compared to other sectors in the economy. Realizing the vision to become the region’s logistics hub requires coordination along the regional corridors of transportation as well as among the different modes of transportation and access.
Ground Transportation: Roads and Railways As of 2018, Namibia had 48,875 kilometers (km) of roads. Road density in relation to area is relatively low, but in terms of population is high relative to peers. There are 16,435 km of roads per person per square kilometer of land area, compared to 2,899 km in Zambia; 7,981 km in Botswana; and 15,746 km in South Africa. Namibia is connected by road to the SADC through an extensive road networking, linking it with South Africa, Angola, and the land-locked nations of Botswana, Zimbabwe, Zambia, and the Democratic Republic of the Congo. These highways link crucial industrial output centers with port and trade destinations. 19 The road reform in 1998 resulted in the establishment of parastatals whose purview include the financing and maintenance of the country’s road network: the Road Funds Authority (RFA) is responsible for providing financing for roadwork; the Roads Authority (RA) manages all national roads; and the Roads Contractor Company (RCC) maintains the road network through limited-time contracts.
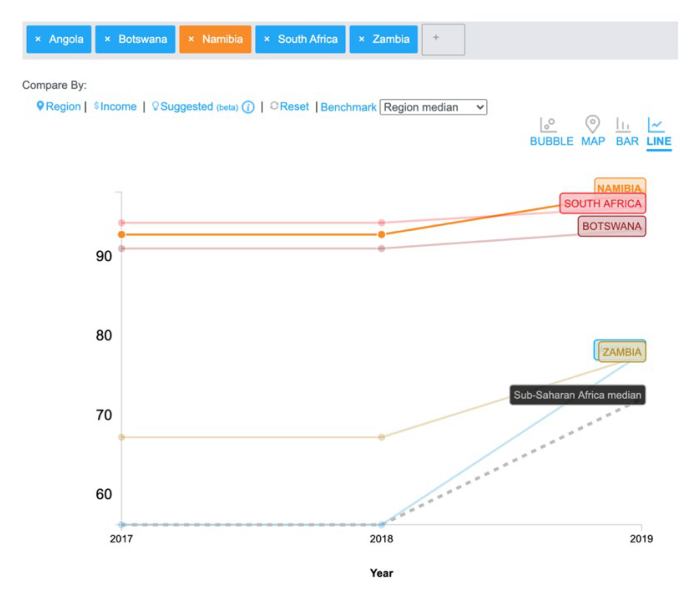
At first glance, Namibia is already ahead of the game in terms of quality and connectedness. It was ranked first globally by the World Economic Forum for its road network for several consecutive years in a row. It not only ranks high on the Road Connectivity Index, 20 but it has historically also
outperformed regional peers (Figure 31). An examination of road congestion and unmet demand for roads suggests that the shadow price is low and there is adequate capacity for current levels of output. Qualitative interviews conducted by the Growth Lab paint an equally positive picture. Several stakeholders across industries and across the public and private sector reported the road infrastructure as Namibia’s comparative advantage as a regional outperformer as well as a platform on which to continue boosting traffic and economic activity. Notable quotes revealed that Namibia is “known for [its] road network and the safety of transporting goods across borders” and that “the road system is top in the continent and is a huge opportunity to leverage.”
Figure 31: Road Connectivity Index 0-100 (Best)
Notwithstanding this optimistic view, the road network does not come without its own set of challenges. Qualitative research suggests that there are concerns pertaining to road safety and the ability to fund road expansion and maintenance. However, rather than pointing to a constraint, these issues suggest the need for a reprioritization of state resources and attention to address these localized challenges. This feeds into a discussion of fiscal sustainability and whether the available resources can support the infrastructure required to spur further investment and growth among the existing engines of growth in the economy. There is little evidence to suggest that lack of access via road is constraining economic activity, and road transportation has remained consistently high-quality even during
Namibia’s growth slowdown and recession. All of these signals suggest that Namibia’s roads and their role in the logistics and infrastructure of the country do not pose a binding constraint to growth and development.
In addition to road connectivity, Namibia also has a reliable and extensive rail network which could greatly bolster the key corridors of transportation between the country and the SADC region. The national rail operator TransNamib 21 took control of the rail lines after Independence and its current priorities are poised to focus on improving the rail lines between Windhoek and Walvis Bay and between Windhoek and Tsumeb in the north.
Multimodal transportation networks are important not only for freight transportation but also to boost the passenger traffic corridors. The African Development Bank has extended a loan to Namibia to build up the railways to meet SADC standards, which is aligned with the five-year Integrated Strategic Business Plan (ISBP) that TransNamib begun in 2019. 22 Interviews repeatedly stressed the importance of “getting the rail network up to par with the roads and port facilities in Namibia” and many were of the opinion that “the biggest hindrance to becoming a regional logistics hub is the rail infrastructure.” These potential improvements and updates to the rail network are likely to increase the throughput at the maritime ports and national border ports. Literature reviews are mixed in the precise estimate of the change in economic output if railways were to displace trade traffic from roads, but what does stand out is the positive effect of interdependence and synergies in ground transport, or “interlogistical connectedness.” 23 Not only would they allow for increased volume of imports and exports, but would also connect population centers with each other and supplement the road access between the southern, central, western, and northern parts of Namibia.
Ports Namibia hosts two main seaports. Walvis Bay, a four-hour drive west of Windhoek and strategically located halfway along Namibia’s coast, is the largest commercial port in the country. The port currently receives approximately 3,000 vessel calls each year and handles 5 million tons of cargo. 24 Though comparable ports in South Africa are more numerous and can handle more capacity, Walvis Bay is well positioned to continue providing high quality service to existing vessels and to expand as necessitated by demand – vessels stuck waiting in South African ports are able to divert to Namibia, and wait times for vessel processing are lower on average. 25 It services the mining, fishing, agriculture, and tourism sectors, with the ability to broaden scope to more industries. The Port of Lüderitz also handles a variety of trade cargo, including offshore diamonds, fishing, and horticulture products. As Namibia’s southern port, it mostly services the mining industries in Namibia and South Africa, and is well positioned to provide nautical access to Europe, the Americas, and even Asia. Namport is the
state-owned operator and regulator of Namibia’s ports. The entity works closely with the Walvis Bay Corridor Group and other logistics-sector actors to oversee the infrastructure and transportation access.
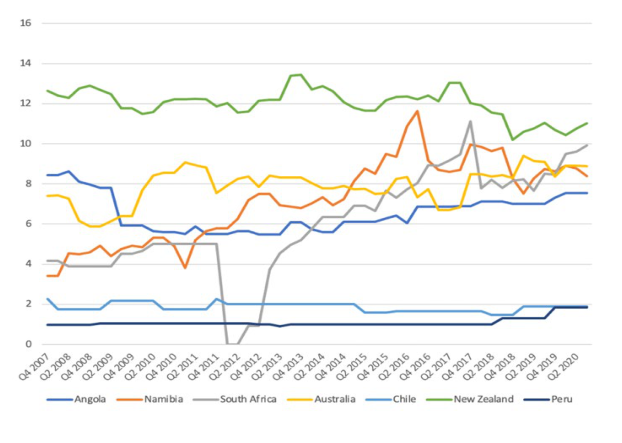
International benchmark indicators of port quality reveal Namibia’s performance over time. The Liner Shipping Connectivity Index (LSCI, by UNCTAD) allows for an assessment of maritime connectivity for container shipping. It is a composite index measured quarterly, based on the number of shipping lines servicing a country, the size of the largest vessel used on these services, the number of services connecting a country to other countries, the total number of vessels deployed in a country, and the total capacity of those vessels (in TEU). The higher the index, the higher the country performs on these indicators. Namibia registered a steady improvement over the years 2007-2016 and has since maintained its favorable positioning within the group of regional and international peers (Figure 32), ahead of Peru, Angola and Chile; only marginally outranked by South Africa, Australia, and New Zealand.
Figure 32: Liner Shipping Connectivity Index
Anecdotal evidence discussed the importance of volumes in sustaining port operations. One respondent noted in response to the sustainability of the ports that, “Namibia has too small of a population to provide a critical mass. There is a high dependency on the hinterlands and other countries to generate significant volumes and flows of goods to be cost effective.” One noteworthy aspect is the dearth of private participation in port infrastructure, which might increase overall
efficiency in terms of expanding volume and handling capacity. 26 The new container terminal at Walvis Bay was done on a PPP basis, but there is significant room for more private-sector activity.
Overall, port infrastructure and access to ports does not present a binding constraint to Namibia. The country invested heavily in shoring up port capabilities early on – during the growth acceleration of the 2000s – and has maintained this distinction in quality during the low-growth period. Firms do not report efforts to bypass this constraint to engage in international trade, nor do they report high tariffs or price barriers. Finally, sectors that rely on access to the ports, such as agroprocessing exporting firms or mining firms, are performing comparatively better than other sectors that might not rely on ports at all. This information further cements the impression that Namibian ports are not a binding constraint, but rather a comparative advantage.
Air Transportation Air transportation is part of a multifaceted logistics network – including roads, rail and ports – in the transport of goods and people. Namibia has over 20 airports. The state-owned Namibia Airports Company (NAC) manages and operates eight of them, including Hosea Kutako International Airport in Windhoek. 27 In terms of freight cargo, Namibia transported 22.2 million tons per kilometer 28 in 2017, compared to South Africa’s 833.9. In fact, Namibia ranked lowest relative to regional and international peers on this front. In terms of passenger transport, Namibia registered 259 passengers per 1000 people in the country, compared to 366 in South Africa. 29 Among Namibia’s economic activities, mining, fishing, manufacturing and broader agriculture are not intensive in air freight, whereas tourism and horticulture sector depend on air transit for exporting and facilitating the movement of tourists across Namibia. Stakeholders in the tourism industry stressed the sector’s potential growth if the international airport was expanded and connectivity to regional airports was easier.
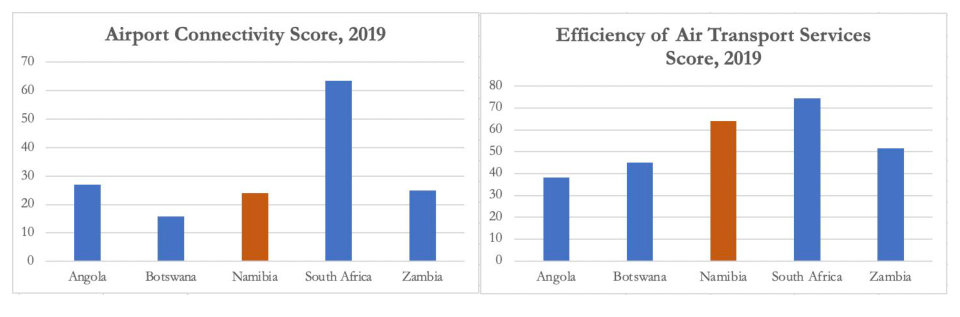
Data on air connectivity and air transport services efficiency ranks for 2019 ranks Namibia higher than regional peers, save for South Africa which is in the top countries in the continent for global connectivity (Figure 33). 30 Even though Namibia ranks in line with regional peers for airport infrastructure, there are arguments to be made for expanding the capacity and of the existing airports and improving the management of them overall. The benefits from improved air transportation include its contributions to a potential booming of the tourism sector, spurring economic activities related to airport functioning or promoted by airport proximity, and leveraging on air freight as a tool 26 Systematic Country Diagnostic for Namibia 2019, World Bank. 27 NAC was also linked to Air Namibia, the national carrier airline liquidated in early 2021. 28 Of airspace. Source: World Bank World Development Indicators 29 Peru transported 500 passengers per 1000 people; Australia 3,018; Zimbabwe 9 30 The IATA airport connectivity indicator measures the degree of integration of a country within the global air transport network. It is based on the number of available seats offered in flights originating from a country. For each airport, the number of available seats to each destination is weighted by the size of the destination airport (in terms of number of passengers handled). The weighted totals are then summed for all destinations, then for all airports in the country to produce a score. This score is then divided by the highest score (United States) and multiplied by 100. The scale of this indicator ranges from 0 to 100 [best]. Source: World Economic Forum Global Competitiveness Index
for export promotion. 31 While these impacts might be relevant to stimulating investments in certain specific sectors, the evidence reviewed indicates that air transportation is not an overall binding constraint to the economy as a whole.
Figure 33: Air Connectivity and Efficiency of Air Transport Services (2019)
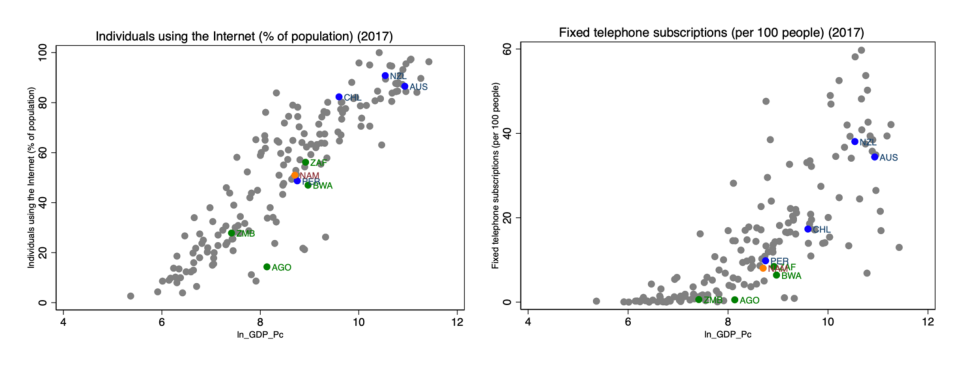
Information Technology & Telecommunications Namibia was an early adopter in the region when it comes to 3G and LTE networks, which is reflected in a reasonably high share of the population with access to internet and a fixed telephone line (Figure 34). 32 The Telecommunication Infrastructure Index ranks Namibia’s performance as in line with regional peers as of 2017.
Figure 34: Access to Internet and Fixed Telephone Subscription (2017)
However, technology adoption remains a challenge to private sector development and entrepreneurship. The World Bank Digital Adoption Index, which measures usage of ICT by various segments of the population, ranks Namibia among the lowest in the continent. In addition, Namibia’s price point for internet service is among the highest in the region – indicators compare Namibia’s price of $4.78/1GB of mobile data to $4.30 in South Africa, $1.36 in Zambia, $13.87 in Botswana, and $5.29 in Angola. 33 Private sector participation in the ICT provision space is also low, despite the entry of a small number of private competitors and the opening of the regulatory environment. 34 This is further compounded by widespread beliefs that came up in consultations with domestic stakeholders about the lack of skills necessary to use digital technology to its fullest potential. On the whole, access to telecommunication tools and the infrastructure in place pose imminent policy priorities in order to develop the human capital workforce of Namibia, but the shadow price of accessing the internet and owning a mobile phone is not particularly high, nor do stakeholders cite this as a major concern for overall business operations, which suggest that it may be demandconstrained rather than supply-constrained.
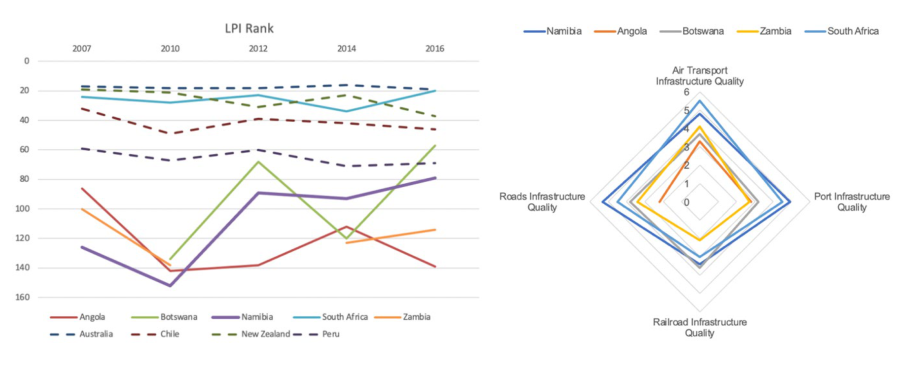
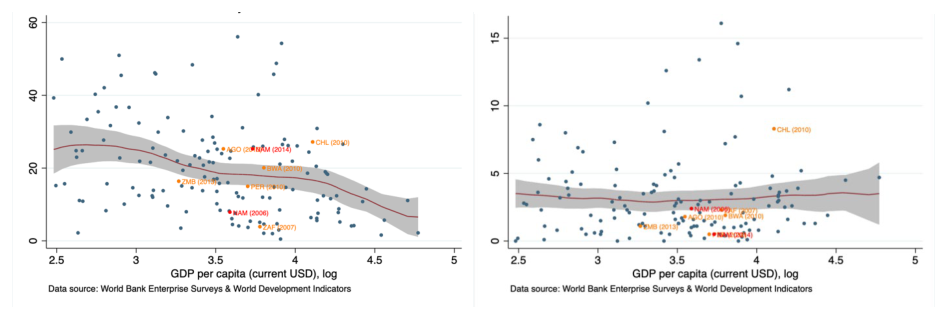
Overall logistics indicators International performance indicators for the logistics sector highlight the improvements seen in Namibia and its standing as a positive outlier in the region. The World Bank Logistics Performance Index (2016) places Namibia in line with regional peers and shows a significant improvement in ranking since the early 2000s (Figure 35). Compared to these peers, Namibia is also favorably rated by other indices in terms of air, rail, road, and port infrastructure. Firms in the Enterprise Survey (2016) are not likely to cite transportation as the main obstacle and are not more likely than peers to cite it as a major problem (Figure 36). The sector is predominantly regulated and operated by public enterprises and corresponding line ministries, and anecdotal evidence suggests there might be gains in efficiency from opening the sector to private and international investors. The infrastructure sector has direct effects on the future of urbanization rates and population distribution, as well as knowhow agglomeration along the transportation corridors. Therefore, while it is a positive factor for the country, it is an ever-evolving factor that needs consistent policy attention and dialogue.
Figure 35: Logistics Performance Indicators
Potential improvements range from the low-hanging fruit endeavor of expanding terminal capacity and upgrading existing grids and networks to the long-term priorities of connecting new centers and population hubs to each other by road or other means. Digital communication is an area for attention to tap into the human capital potential in rural areas. Gradual and sequenced private sector involvement could help on the infrastructure side as well as the operational front. Recent developments are optimistic – the collaboration with ADB to fund expansion projects, the strategic plans that incorporate upgradations across the board to develop the SADC regional corridors, etc.
Figure 36: Share of firms identifying transportation as a major (left) and a main constraint (right)
Infrastructure and logistics do not present a binding constraint to inclusive growth and sustainable growth. Despite gaining independence later than most modern economies, Namibia’s infrastructure is mature beyond its years. The extensive road and port network speak to the potential for Namibia to cement its path towards a regional hub for logistics. This has implications on the potential for agglomeration effects and economies of scale, especially near the coast. The railway and air transport network have space to catch up and expand to unlock gains in volume trade and movement. Nonetheless, infrastructure overall stands as a comparative advantage for Namibia, and not a binding constraint.
4.2.3 Water Namibia is one of the driest countries in Sub-Saharan Africa. It has both low and variable precipitation rates, with an estimated 97% of rainfall being lost to evaporation, 2% remaining as surface run-off and only 1% recharging groundwater. About 70% of the country’s land surface being arid or semiarid. 35 Water is only relatively “abundant” around rivers, like the Orange river on the border with South Africa and the Kunene river on the northern border with Angola. According to the UN’s Aquastat data, Namibia is in the 14 th percentile of countries in terms of average annual precipitation but is in the 75 th percentile in terms of renewable water resources per capita, mostly owing to the rivers. Still, due to the large size of the country and the difficulty and cost associated with transporting water, around 40% of Namibia’s freshwater is extracted from the earth via wells, which leaves the country very vulnerable to droughts.
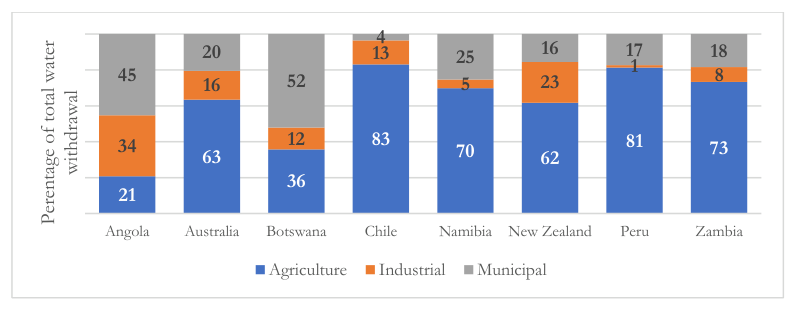
Namibia has significantly expanded access to water and sanitation since independence. According to the WHO and UNICEF’s Joint Monitoring Programme for Water Supply, Sanitation and Hygiene, Namibia has expanded basic improved drinking water access from 77% of the population in 2000 to 83% in 2017, with much of the gains stemming from migration from rural to urban areas, where access to public services is more widespread. Likewise, access to basic sanitation has increased from 37% of the population in 2000 to 47% in 2017, partly because of improvements in rural areas and partly because of rural-urban migration. In terms of uses of water, Namibia stands out amongst peers for having the second lowest share of industrial water consumption – just ahead of Angola (Figure 37).
Figure 37: Water use by economic sector (2017)
Namibia’s water sector has a similar structure to the electrical system. A state-owned enterprise, Namwater, sells water in bulk to other entities (mostly municipalities and sub-national entities), that in turn distribute the water to end-customers. NamWater also supplies some large customers (mines) directly, as well as some remote regions not adequately covered by sub-national entities. Bulk water is sourced from groundwater, reservoirs and dams that collect rainwater, and from rivers, depending on the region. The Water Regulator of Namibia (WRN), recently set-up in 2017 36 under the Ministry of Agriculture, Water and Forestry, determines fees and charges so that Namwater may recover costs and meet other social objectives.
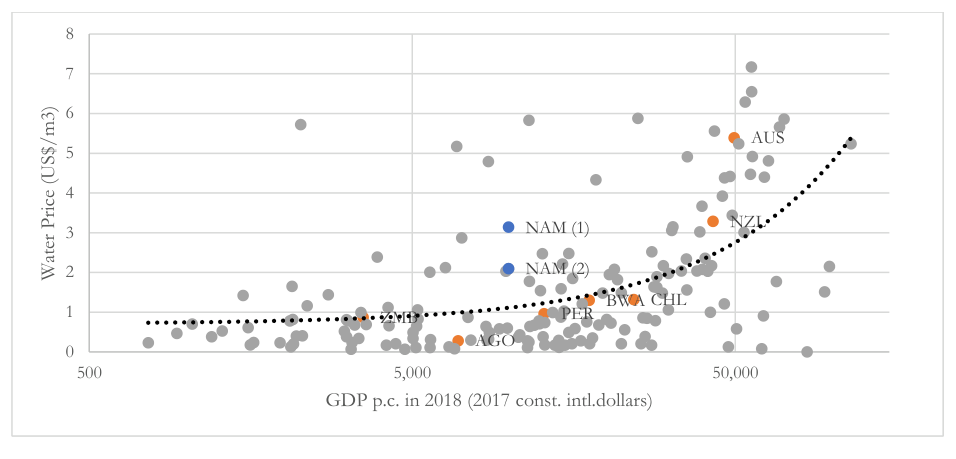
WRN sets up water tariffs so that they are somewhat cost reflective. The average household price of water across all of Namibia is US$ 2-3 per cubic meter – depending on the computation method used by the data source – well above Chile, Peru, Botswana, Angola and Zambia – and also well above most countries of Namibia’s income level (Figure 38). Authorities from NamWater explained that at current tariff rates, NamWater does not require an explicit subsidy from the state. However, it does receive indirect subsidies through capital transfers, such as for the Neckartal dam completed in 2020.
Figure 38: Water prices vs. Income Level
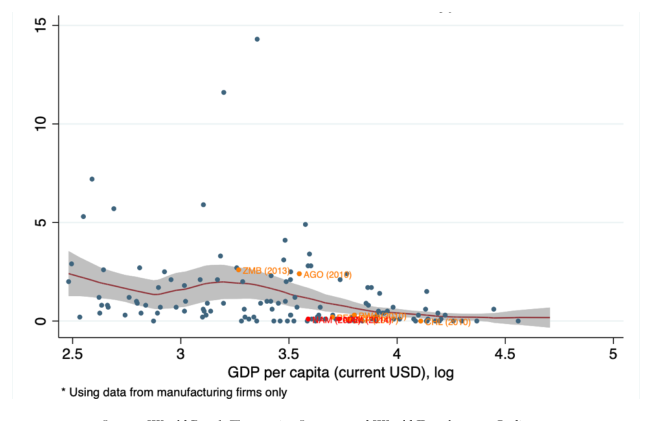
Firms surveyed in the 2014 WB Enterprise Survey did not generally report that access to water as a significant obstacle to their businesses. Just 4% of firms reported water insufficiencies (Figure 39), a number lower that the average for Sub-Saharan Africa (22%) and the rest of the world (13%), in line with most peers except Zambia and Angola. Nevertheless, within the subset of large firms, 22% of
respondents did mention water inefficiencies, roughly the same rate as Sub-Saharan Africa and the rest of the world.
Figure 39: Number of water insufficiencies per month
This survey data is consistent with the qualitative findings derived from the Growth Lab’s interviews with stakeholders, where just 6% of them mentioned it over the course of consultations. When explicitly asked about water access and price, firms largely characterized it as a non-issue. These qualitative results must be interpreted cautiously, however. Firstly, our pool of stakeholders, while carefully curated, is small. In addition, by definition, the stakeholders that are available for interviews are those that are viable in Namibia and have adapted to local conditions. Thus, qualitative interviews do not readily reveal how binding a particular constraint is on firms and economic sectors that are not present in Namibia.
That said, although water does not appear to be binding to the median industry based in the available evidence, both the mining and agriculture sector depend critically on water for their operations. Most noteworthy, Uranium mines have set up expensive desalination plants to create freshwater from the ocean. Thus, although water is not likely to be a binding constraint for the median sector of the economy at the time of writing, it may still be binding for specific activities – such as agriculture and mining – within certain regions.
Demand for water is projected to rise rapidly in Namibia from 583 Mm3/year to 635 in 2025 and 771 in 2030, mostly due to the projected increase in water for irrigation. 37 To the extent that drought conditions become more frequent and severe with global climate change, water could become more binding on existing and potential economic activities. Thus, although the supply of water does not appear to be problematic at this time, it should remain an area of policy focus in the coming years.
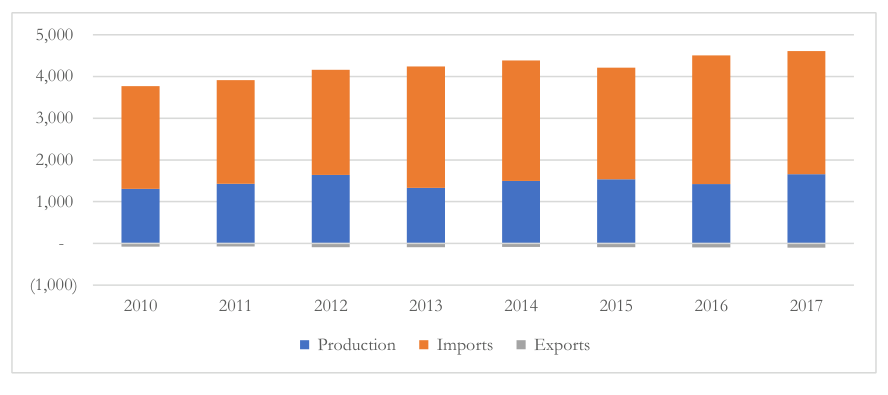
4.2.4 Electricity Namibia imports about two thirds of the electricity it consumes (Figure 40). Most of imported electricity is from South Africa (82% of the total in 2017), although in recent years Namibia has signed power purchase agreements (PPAs) with Botswana, Zambia, Zimbabwe, the Democratic Republic of Congo, and Mozambique, in an effort to diversify its supplier base. The remaining one third is produced within Namibia by the Ruacana hydro plant, a 330 MW run-of-the-river station built in 1978 on the Kunene river; a few fossil-fuel plants, the largest of which is 120MW Van Eck thermal plant, built 1972 in Windhoek; and some recent solar capacity.
Nampower has taken some steps to reduce reliance on electricity imports, for instance by installing a new 92 MW turbine at the Ruacana hydro plant in 2012 and undertaking two new solar, two new wind projects and one biomass project. 38 Still, demand for power continues to outpace the increase in domestic supply.
Figure 40: Electricity Production, Imports and Exports in Namibia (GWh)
The state-owned enterprise NamPower oversees power generation and transmission, while regional electricity distributors, local authorities, regional councils, third-party entities and in some cases NamPower itself, take charge of electric distribution. The sector is regulated by the Electricity Control Board (ECB), tasked with issuing licenses and setting tariffs such that the sector can operate and cover “approved costs” without the need for explicit state subsidies.
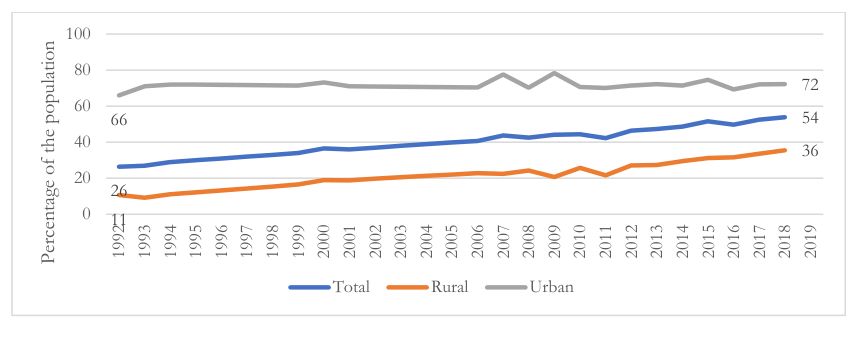
Access to electricity has increased from 25% of the population in 1990 to 54% nowadays. Thus, close to half of all Namibians do not have access to electricity. Furthermore, a significant urban-rural gap remains, with 72% of the urban population having access, twice as much as those in rural areas (Figure 41). Needless to say, electricity is a crucial input to modern economic production, and differential access differentially limits opportunities across large swathes of the population and Namibia’s geography.
Figure 41: Electricity Access in Namibia
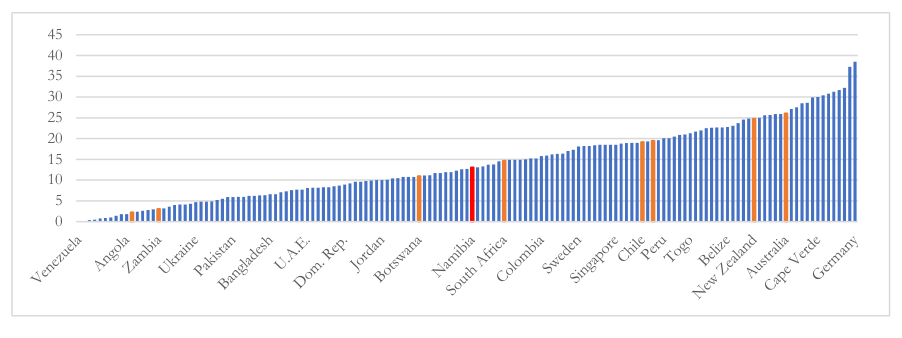
Unlike many peers in the South African Development Community (SADC), Namibia’s electricity prices largely reflect the direct costs of provision. As GIZ writes in its 2020 report, “the base electricity price 2019/20 for large off-takers (regional electricity suppliers, municipal utilities and industrial customers) is 1.65 NAD/kWh [approx. 0.11 US$/kWh]”. 39 Distributors then add on their margin, which may vary by season, time of the day, total consumption and customer type, resulting in “average electricity consumption costs between 2.20 and 2.60 NAD/kWh [0.15-0.17 US$/kWh] for commercial electricity consumers.” This assessment is consistent with Namibia’s ranking in household electricity prices (Figure 42), according to which the country has higher household electricity prices than Angola, Zambia and Botswana, and lower prices than South Africa and its non-African peers.
Figure 42: Household Electricity Prices (US$ cents/kWh)
By and large, firms evaluate Namibia’s electricity system in a favorable way. In the 2014 World Bank Enterprise Survey, respondents were far less likely to mention electricity as a major constraint to their business relative to regional, international peers, and countries of the same income level (Figure 43, Panel A). This finding applied to all firms in general, and in particular to the subsets of exporting and manufacturing firms. Moreover, Namibian firms tended to have fewer (Panel B), less costly power outages (Panel C) and were less likely to own an electric generator, which usually signal issues in the system (Panel D). These responses are consistent with the qualitative findings coming from the Growth Lab’s interviews with stakeholders, where electricity was not an issue that came up spontaneously in conversation often and over half of mentions were neutral or positive.
Figure 43: Electricity Indicators from Enterprise Surveys
B. Number of electrical outages in a typical month A. Percent of firms identifying electricity as a major constraint
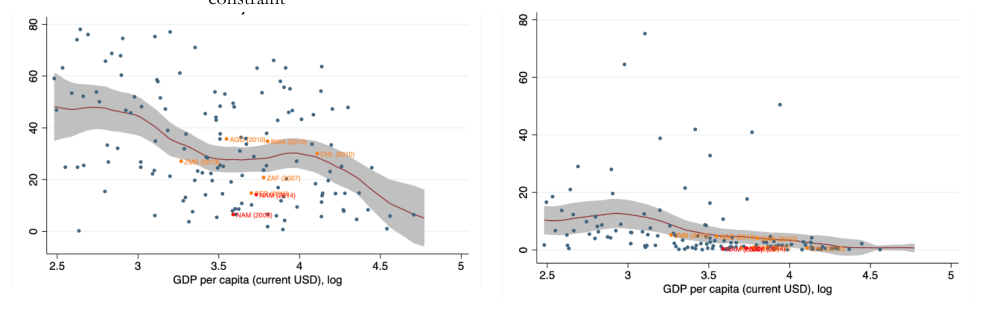
C. Losses due to electrical outages (% of annual sales) D. Percent of firms owning a generator (%)
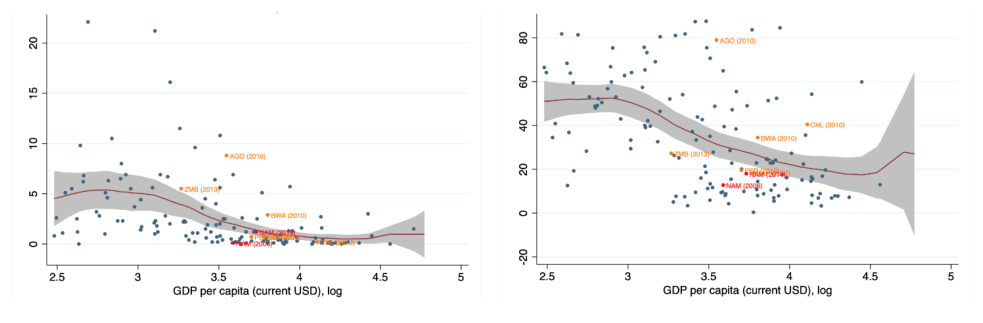
The responses to the Enterprise Surveys and the qualitative findings resulting from the Growth Lab’s interviews with stakeholders might be potentially biased if existing firms are not relatively more intensive in the use of electricity. In order to rule out this possibility, we relied on the input-output matrix prepared by van Seventeer for 2007 for 24 categories of economic activities 40 and tested is
firms that are more intensive in the use of electricity have grown less (or more) than the Namibian average. 41 The input output matrix reveals that Namibia’s most electricity intensive industry, by a wide margin, is water (with 4% of its overall costs going to electricity). Then, ranking of electricity intensity by industry depends slightly on whether labor and capital costs are included in the cost base of each industry. If they are included, the electricity sector is the second activity that is most intensive in electricity, followed by heavy manufacturing, meat processing and government services. Out of the 24 sectors, mining is the eighth most electricity intensive.
Unfortunately, the 24 categories in the van Seventeer input-output matrix do not map neatly onto the GDP by production national accounts, which are compiled under 41 categories. Still, heavy manufacturing (which we take to include chemicals, rubbers, plastics, non-metallic minerals, nonferrous metals, fabricated metals, diamond processing and others) grew at a CAGR of 1.4% per year in 2007-2019, underperforming secondary industries in general, which grew at 2.1% on average in the same period. In contrast, meat processing grew at a CAGR of 4.9% per year between 2007 and 2019, a rate much greater than the 2.5% contraction for secondary industries.
Government services, which is much less responsive to price signals, grew at a CAGR of 3.7% between 2007 and 2019, a rate much higher than the average of 2.5% for secondary industries in the same period. Mining and quarrying, meanwhile, grew 0.2% per year on average compared to the 0.4% contraction for primary industries in general over the same period. Overall, we did not find any evidence that sectors more intensive in the use info electricity are consistently growing at a slower pace than the rest, a feature that suggests that electricity is not likely a binding constraint.
Namibia’s authorities implemented in 2019 the Modified Single Buyer Scheme (MSFB), allowing independent power producers (IPPs) to set up their own generation capacity and sell directly to eligible buyers up to 30% of their total consumption. The introduction of this regime represents an opportunity for IPPs to set up solar and wind generation capacity which can contribute to lower the average prices for consumers. During the Growth Lab’s interview with NamPower, authorities explained that the 30% limit will be gradually raised as power purchase agreements phase over the coming decade and as the system adapts to the new, renewable energy sources that are being introduced. The MSFB represents an important step in tapping Namibia’s enormous potential for solar energy, which is focused along the coast and in the south (Figure 44).
Figure 44: Solar Potential in Namibia
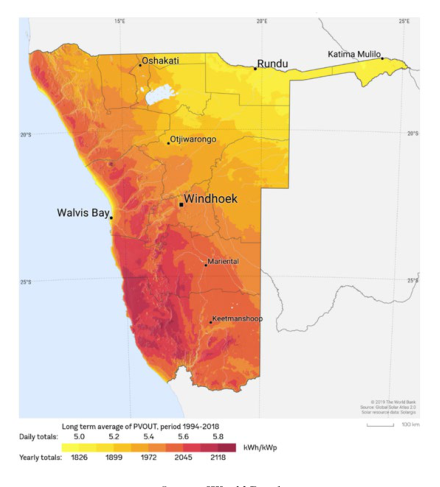
Overall, we did not find significant evidence pointing to electricity as a binding constraint to economic growth in Namibia. Expanding access to electricity will continue to be a challenge due to the investments required to extend the network to the remaining unplugged areas and the liquidity problems at some of the distributors. Green energy will continue to be a significant opportunity, in particular, as technological improvements continue to drive battery prices down.
4.2.5 Land The policy environment around land reform has centered around an agenda of social inclusion and correcting past inequities. While these policy discussions are essential in a new democracy still overcoming the legacy of exclusion from colonial rule, access to land is in its own right an economic input into the production function of the economy. To that end, this section evaluates whether the availability of land or the mechanisms for allocating these resources might be a binding constraint to investment and growth.
Availability of Land At first glance, it would not seem that land in Namibia is scarce. It is the second-least densely populated country in the world, with a density of just under 3 people per square kilometer. By contrast, neighboring South Africa exhibits a density of almost 48 people per square kilometer. Moreover, despite unequal concentration of the country’s 2.5 million inhabitants (Figure 45) density is low even in the most populated areas of the country. 42
Figure 45: Spatial population distribution in Namibia
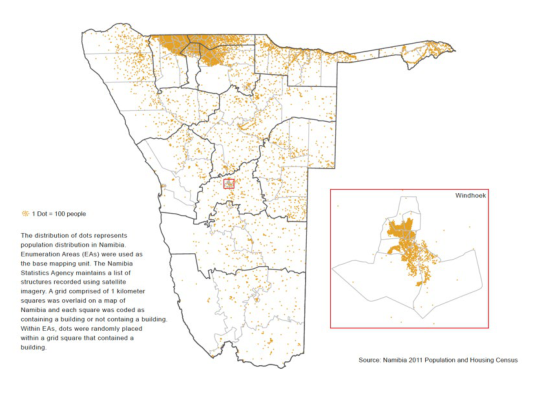
When considering the availability of land relative to demand, the Enterprise Survey data from 2014 shows an increase in the share of firms from 2006 that identify access to land as the main constraint. This share stood at 20% in 2014 (Figure 46) and was particularly high for firms located in Windhoek and Okahandja. The Namibian Business and Investment Climate Survey (NamBIC) of the same year indicate that access to land was frequently cited as a constraint, but in terms of prioritizing the most binding issues it lagged low demand (for products and services), access to high skills, and access to finance. 43
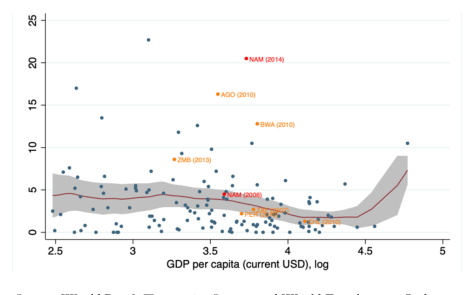
In the NamBIC survey, land was identified as a significant obstacle to business expansion, with 47% of respondents indicating they would need additional land for an expansion of operations and the vast majority of these firms considering that accessing this land would be difficult. It is noteworthy that firms back then complained about accessing serviced land in commercial areas on the grounds of being prohibitively expensive. In the absence of more recent data on the same indicators, anecdotal data points suggest that the focus now is more on the regulatory hurdles of accessing land rather than price points being too high. In this same regard, the World Bank 2019 doing business indicators places Namibia at the bottom of all the indices on registering property. It has the lowest overall score on registering property in relation to its peers, 44 the greatest number of procedures involved to register land, and the highest cost as a share of property value (Figure 47).
Figure 47: Registering Property Indices from World Bank Doing Business Indicators (2019)
A. Registering Property Score B. Number of Procedures to Register Land
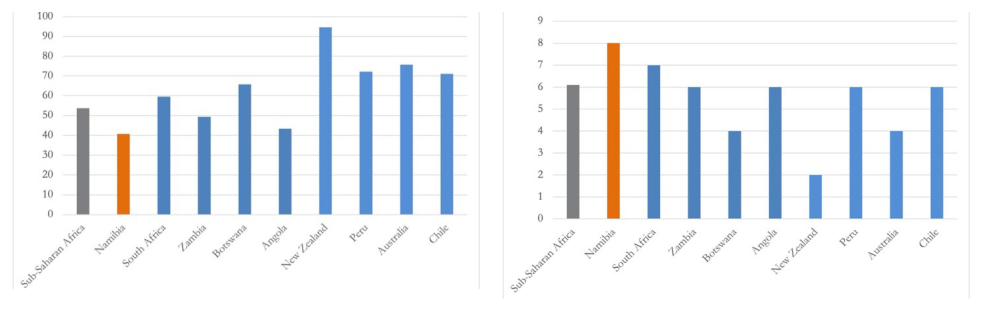
C. Cost of Registering Land (% of Property Value) D. Quality of Land Administration Index (0-30)
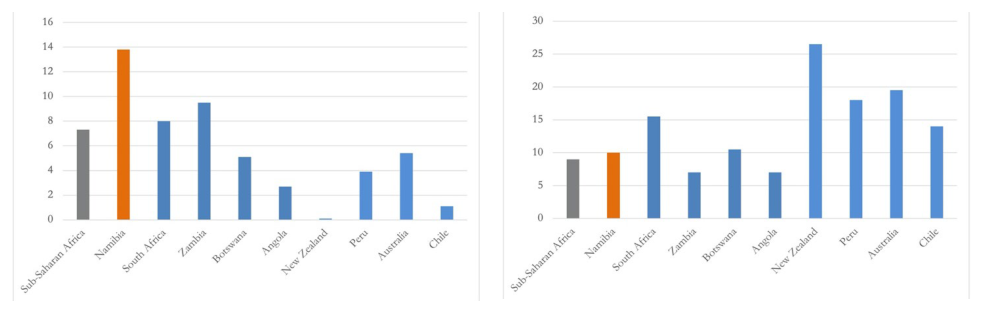
Mechanisms to access and allocate land For the purposes of this section, we will focus on two types of land: freehold land and communal land. Freehold land can be wholly owned, transferred, and surrendered by the individual entities that possess them. Meanwhile, in communal areas Namibians have rights to the land, but not a claim on ownership. The state owns all communal land, 45 and the use of it is administered and moderated jointly by Traditional Authorities (TA) and Land Boards (LB). 46 The Namibian Constitution grants all people the right to acquire property in Namibia, but the legislative branch (Parliament) has the regulatory authority of foreign nationals’ ability to do so. However, only freehold land is available for direct purchase. Additionally, all Namibians can apply for 99-year leaseholds, which may be transferred, inherited, renewed, and mortgaged in conjunction with TAs and LBs. Foreigners may also apply to leaseholds but there has been recent debate on whether the duration of these should be the same as for Namibians or significantly shorter. 47 These lease documents are not collateralizable, a feature with obvious implications in securing financing for investments in communal lands.
Regarding the acquisition of land, it is worthwhile to mention that the policies surrounding national resettlement 48 introduced the willing-buyer-willing-seller principle to create a system through which commercial land owned by previously advantaged groups could be redistributed directly to previous disadvantaged Namibians. However, it is widely alleged that in practice the principle has led to a suboptimal targeting of previously disadvantaged groups. Furthermore, qualitative research suggests that following the willing-buyer-willing-seller principle has driven up prices in nearby and urban areas. Concerns were also voiced that simply access to land was not sufficient, since the economic output depends on complementary inputs of technology, labor, appropriate knowhow, and demonstrated ability to continue using the land for productive output. In 2010 the Agribank and the German Society of International Cooperation (GIZ) introduced the Farmer’s Support Project 49 to integrate training and mentorship into the resettlement process and facilitate the upskilling on these complementary inputs. 50 In the 2018 land conference the government considered abolishing the willing-buyer-willingseller principle, but in the end the principle held up on constitutional grounds. 51 Gradual policy measures towards “unifying the laws governing communal and commercial lands for more intensive use” have been implemented over time. 52 Land Boards can now allocate up to 100 45 The state owns the land on behalf of and in the trust of indigenous tribes. 46 In Namibia, the Constitution asserts that all land, water, and natural resources that are not legally owned by an entity belong to the state; thus, communal lands are definitionally the property of the state, even though Traditional Authorities (TAs) and Land Boards (LBs) oversee the allocation and supervision of land in these areas. 47 Recently, this caused discontent in the case of a 99-year lease for Chinese tobacco producers due to the question of why a foreign entity should be granted equal land access as Namibians. The lease was subsequently granted for only 25 years. 48 Including the Agricultural Commercial Land Reform Act of 1995 and the National Resettlement Policy of 2001. 49 This is linked to the insufficient funding of Agribank’s Post-Settlement Support Fund and its prohibitive loan limits that was too low to help the resettled farmers. 50 A major hurdle farmers face is how to adopt and keep up with modern modes of production. 51 https://www.namibian.com.na/207976/archive-read/Willing-buyer-willing-seller-to-stay. 52 Gargallo, Edward (2020). Community Conservation and Land Use in Namibia: Visions, Expectations and Realities.
hectares per plot, foreigners can request a leasehold in communal areas, and community-based organizations can pool together to obtain leaseholds and sublet the land to investors. However, the “commercialization of communal land,” is not without risks. These include jurisdictional uncertainty, heterogeneity in dispute resolution and legal channels, limited central government enforceability and tensions around the trade-offs of environmental sustainability and the productive use of land.
Other means of availing land in communal areas have been implemented as an attempt to bypass the legislative and ownership structure in communal lands that otherwise may have curtailed access to the land for productive purposes. These involve Green Schemes and Conservancies – for the agriculture and tourism sectors, respectively – in order to incentivize public-private partnerships to boost those sectors. Green Schemes are government operated (with a few private players) agricultural projects in the central-northern and north-eastern regions to leverage the irrigation opportunities from the Kunene, Kavango, and Zambezi rivers. 53 Conservancies were heralded as a new model for joint venture operations to focus on natural resource conservation and tourism development: private investors are allowed to operate in communal conservancies, and the local communities have a stake in the operation and management of the land themselves. However, several qualitative sources highlight that many Green Schemes and Conservancies are yet to be utilized and set up, illustrating that the constraint may not be the land itself but complementary inputs to capitalizing these opportunities.
At last, producers of cattle and livestock located in communal land above the red line are clearly disadvantaged as they cannot export their product. This seems to be more related to the porous nature of the northern border with Angola and traditional grazing patterns. Hence, it is unclear whether alternative land arrangements on their own would be sufficient to overcome this constraint.
In conclusion, understanding access to land in Namibia is rife with intricate considerations. Namibia is one of the least densely populated country in the world, and the technical definition of “land” renders this resource plentiful. Even though access to land was frequently cited as a constraint to expansion during the height of the growth acceleration – particularly for firms located in Windhoek and Okahandja – more recent qualitative information and data points suggest that concerns are less focused on the relative availability or cost of land 54 and more on bureaucratic hurdles to register property.
Means of accessing and allocating land have been increasing in number and nature. They still face challenges in terms of effective execution, jurisdictional uncertainty and risks of enforcement – in particular in communal areas. However, most of the schemes designed to overcome these challenges (green schemes, conservatories, etc.) remain under-utilized or under-demanded. This signals that likely other key inputs are missing that are preventing investments and growth in pockets of opportunity (agriculture, tourism, etc.) in northern communal lands.
The evidence examined suggest that in general land is not an active constraint to growth in Namibia. However, complex bureaucratic and overlapping ministerial process might turn access to land into a more binding constraint in the event of a prolonged growth acceleration. Other than these, valid concerns around climate-related factors (in particular the increasing prevalence of droughts), potential migration pressures on housing and property in urban areas, and the continued legacy of apartheidbased land allocation have significant implications for the need to strategically consider land access and use in the future.
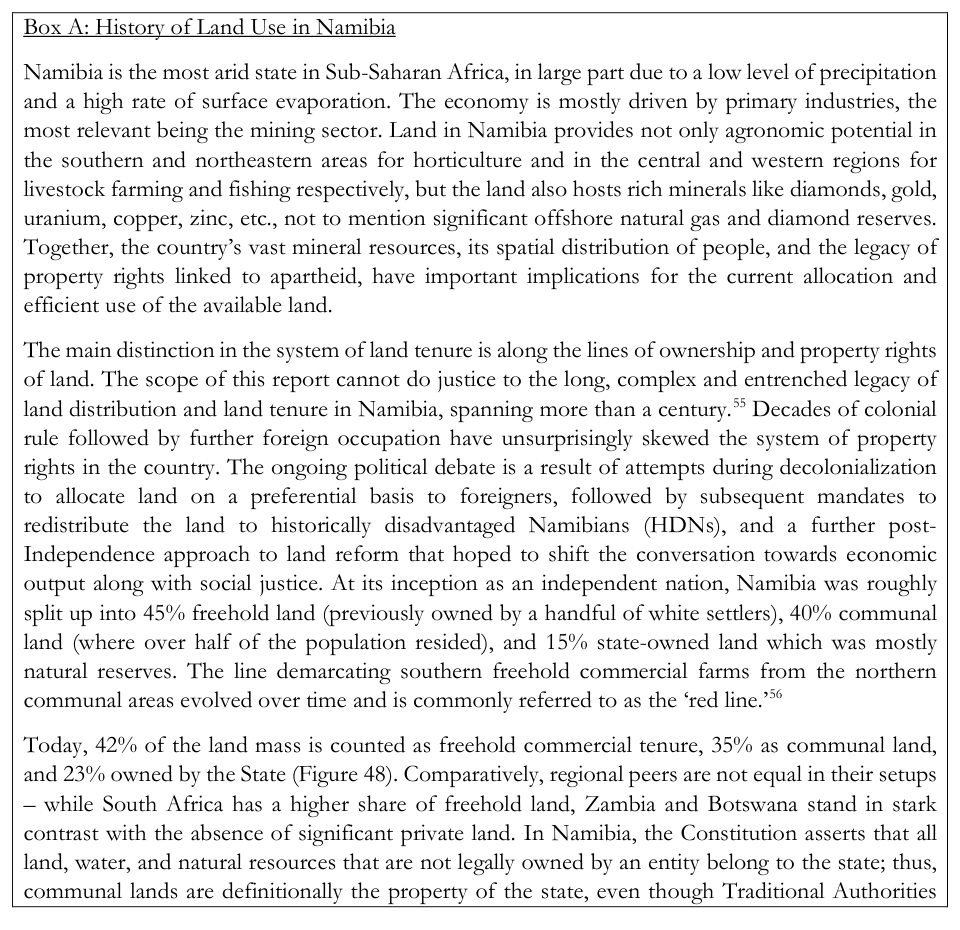
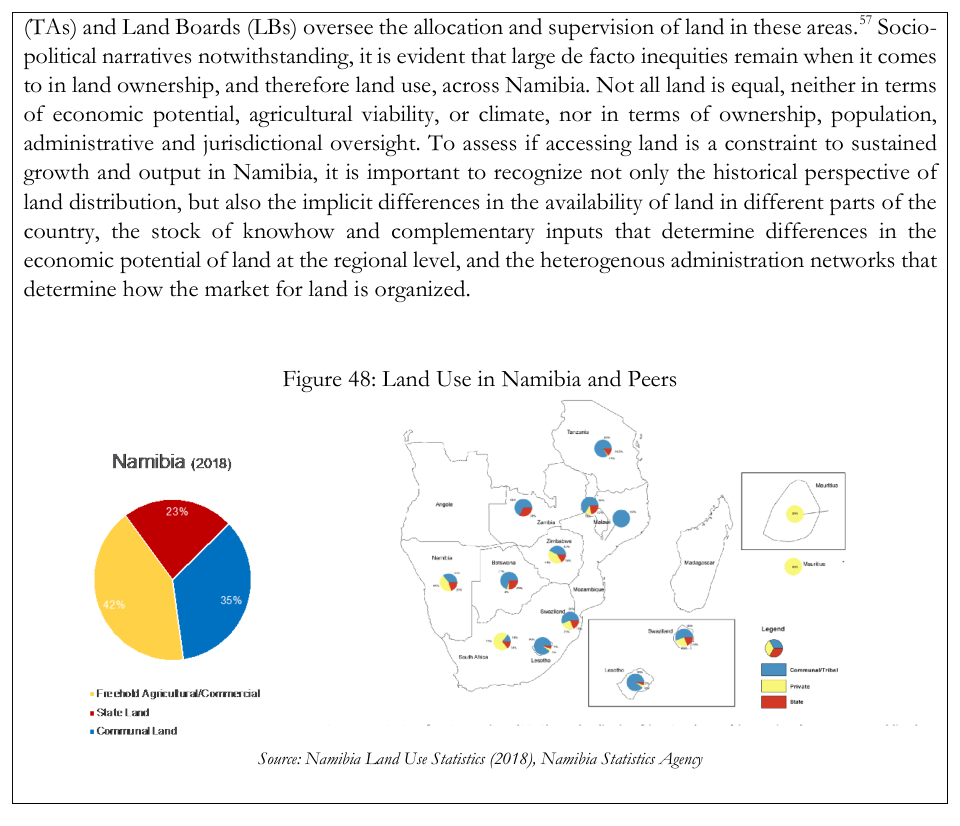
4.3 Government failures This section of the analysis covers potential government failures as a binding constraint. The focus of this section is to understand whether potentially viable investments are not being carried out because government policies diminish the potential appropriability of these investments. This area of the analysis touches upon tax policy, trade policy, labor regulation and policy uncertainty.
4.3.1. Tax rates and tax administration Namibian tax rates and collections do not seem to be excessive relative to benchmark peers or significantly affect business competitiveness. There is space for improvement on certain aspects of tax administration – such as businesses’ time burden of complying with tax procedures – but there is not significant evidence that taxes are a binding constraint for economic growth in Namibia.
Namibia’s tax structure Over the previous 15 years, Namibia’s public revenues have averaged 32% of GDP, but displayed some volatility, (Figure 49, Panel A). Volatility is mostly driven by taxes on international trade, which are derived from the South African Customs Union (SACU) and represent on average a third of public revenues. Other than SACU, the three other important components of public revenues – corporate and personal income taxes, and taxes on goods and sales – display significantly more stability (Figure 49, Panel B).
Figure 49: Tax revenues in Namibia
A. Tax revenues (2006-2019) B. Most important taxes (2006-2019)
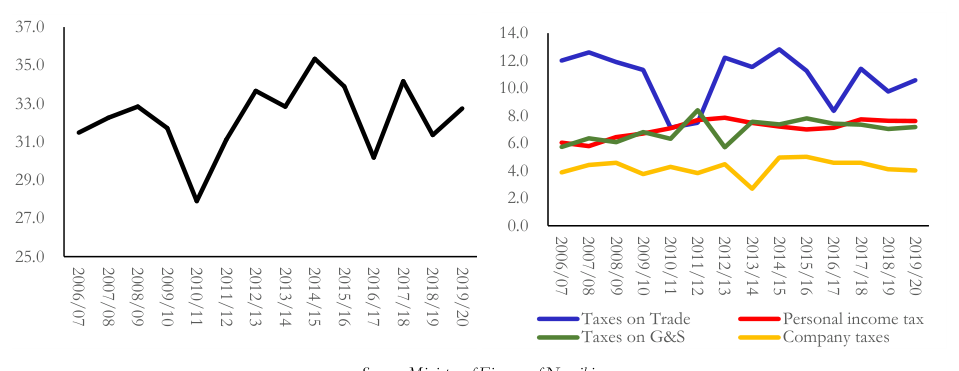
Significant drops in tax revenues, most notably in 2010 and 2016, were driven by large swings in SACU revenues. The drivers of SACU instability are at least in part driven by the composition of the revenue
sharing formula. 58 At present, the common revenue pool relies more heavily on customs duties and less so on excise taxes. Custom duties tend to exhibit instability, as trade tends to be procyclical, especially with discretionary imports falling during contractionary cycles. 59 As a consequence, at times when Namibia has seen GDP weaken and imports decline, SACU revenues have moved in the same direction rather than serving as a buffer.
Apart from SACU, it is also noteworthy that direct and indirect tax revenues have experienced a slow but steady decline since their peak in 2014/2015, in particular corporate income taxes and taxes on goods and services.
Namibia’s Comparative Tax Structure Namibia has the highest level of tax revenues as a percentage of GDP among benchmark peers (Figure 50). This result is also driven by SACU, as the country ranks near the median of regional and international peers in collections of direct taxes (personal and corporate income taxes) and taxes on goods and services. Excluding taxes to international trade, Namibia’s public revenues are equivalent to 20% of GDP, only below New Zealand (27%), South Africa (26.5%), and Australia (23%). Interestingly, the features of Namibia’s tax structure resemble more that of high-income and OECD countries than developing nations, with a larger share of collections coming from direct taxes on individuals and companies (12% of GDP), and a relatively smaller one coming from indirect taxes levied on consumption (7% of GDP).
Namibia’s advantage on direct taxes vis-à-vis benchmark peers seems to be more a consequence of efficiency in tax collections rather than to higher statutory rates (Figure 51). The Corporate Income Tax (CIT) rate of 32% 60 ranks second among peers – only behind Zimbabwe’s 35% – but not far from Australia and Peru (30%) and even South Africa (27%). Regional peers Angola (25% 61 ) and Botswana (22%) exhibit the lowest CIT rates among peers.
Since 1993, Namibia has a differential 18% CIT for companies that have been awarded manufacturing status, which ends after their first ten years of registration. 62 Namibia and Botswana (15%) 63 are the only countries across benchmark peers that have differential rates for manufacturing companies. Neighbors Angola and Zambia have differential rates of 10% and 15% for firms engaged in agricultural and the processing of agricultural products. 64 Other countries like Chile (25%), Australia
(26%), and South Africa (0%, 7% or 21% depending on taxable income levels), have lower CIT rates for SMEs. 65
Figure 50: Tax revenues (% of GDP) (2018)
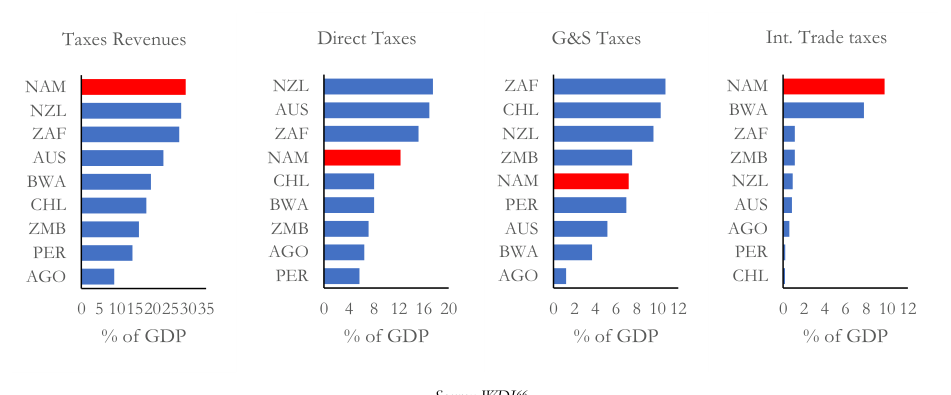
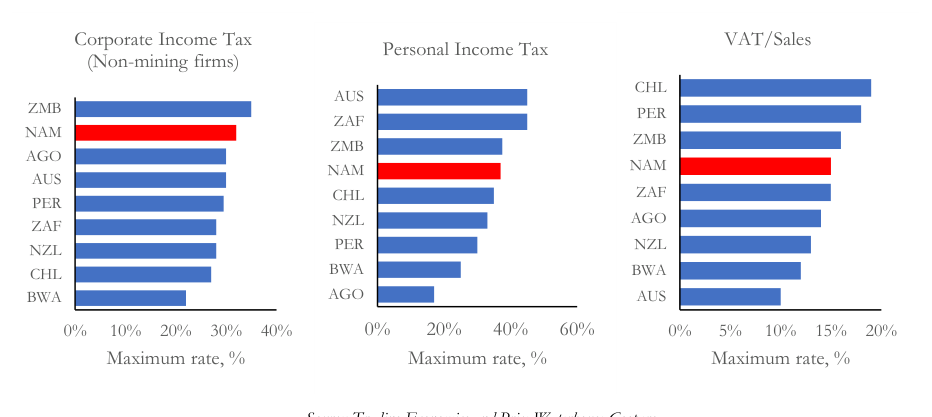
The mining sector in Namibia is also subject to differential CIT rates: 35% in the oil and gas sector, 37.5% for non-diamond mining, and 55% for the diamond mining sector. The mining sector also pays royalties that range from 2% for industrial minerals to 10% on rough diamonds. Besides Namibia,
only Botswana and Angola impose different CIT tax rates on extractive related activities. Botswana has tax rates that range between 22% to 55% depending on taxable income as a percentage of gross income. 67 In contrast, Angola only has a differential rate of 35% for oil companies, just reduced down from 50% in July 2020. Namibia’s mining taxes are broadly in line with neighboring countries Angola and Botswana but are higher than other benchmark peers which tax companies in the sector at the general CIT tax rate.
Maximum personal income tax (PIT) rates rank in the middle of benchmark peers and have remained constant at 37% for the past decade. Similarly, Namibia’s 15% VAT rate is not an outlier when compared to other countries. In fact, VAT tax compliance was relaxed in 2016, when the compulsory VAT registration threshold increased from N$ 200,000 to N$ 500,000. 68 Tax administration and compliance Tax administration does not appear to be a major problem in Namibia either. According to the World Bank Doing Business, Namibia ranks 88 th across 190 countries in the Paying Taxes indicator and 7 th among our benchmark peers (Figure 52). Namibia ranks fairly well in the number of yearly tax payments and the post-filing index, 69 in particular when compared to the regional sub-Saharan African (SSA) average. However, on time spent by businesses in filling and paying taxes Namibia ranks 155 th in the world (among 190 countries), the highest among all regional and international peers. While there is space for improvement in tax administration matters, it does not appear to be a binding constraint for business growth in the country.
Figure 52: Paying taxes Doing Business Indicators (2020)
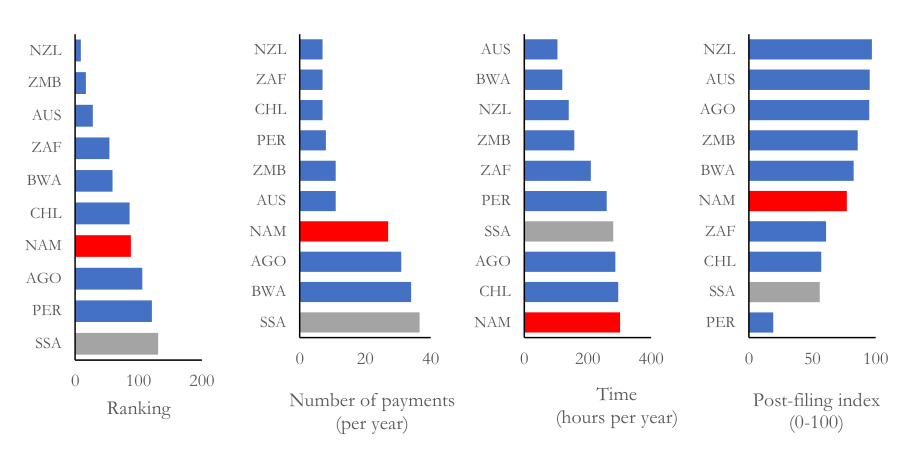

According to the World Bank Enterprise Survey, only 1.4% of firms stated that taxes were a major obstacle for their businesses (Figure 53). In fact, the proportion of firms concerned with taxes fell sharply from the levels seen in 2006. Similarly, only 1.1% of firms identified tax administration as their biggest obstacle for growth.
Figure 53: Main obstacles for firms’ growth: Namibia (All firms)
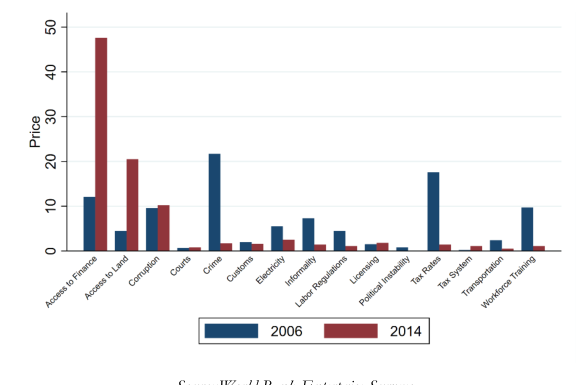
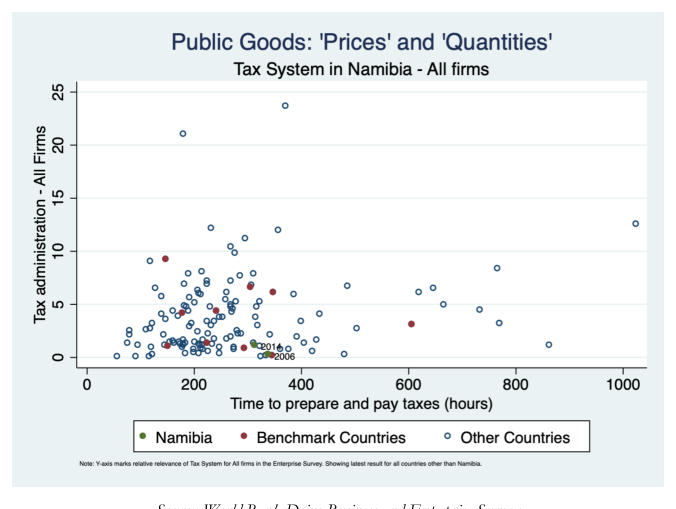
Even if it is true that firms in Namibia spend more hours filling and paying taxes, they do not consider tax administration a major concern as is the case in other countries around the globe (Figure 54). There is also no evidence suggesting that tax rates or tax administration represent a differential burden by firm size. Small (1.6%) and medium (0.9%) firms are not particularly concerned about tax rates and are slightly above the level seen for large firms (0.4%). The same holds true for tax administration with only 1.4% of small firms and 0.3% of medium firms stating it as their biggest obstacle for growth. Moreover, taxation was not one of the constraints mostly cited during our conversations with Namibian stakeholders.
4.3.2 Trade Policy Namibia has been an open economy since independence in 1990. Foreign trade represents 84% of GDP in 2019 and is pivotal to its economy. 70 It is a member of the South African Customs Union (SACU),) with a common external tariff structure, revenue-sharing arrangements and common monetary area (all member countries, except Botswana have their currencies pegged to the South African Rand). 71 Namibia participates in the Southern African Development Community (SADC), a free-trade area consisting of sixteen countries. 72 The country is a regular WTO member, and has several other trade-facilitating agreements with Angola, Tunisia, Zimbabwe, Cuba, Ghana, India, Malaysia, and Russia. Namibia also enjoys duty-free access to the United States under the African Growth and Opportunities Act (AGOA). 73 More recently, Namibia became one of the 31 African Union member countries to ratify the African Continental Free Trade Area (AfCFTA), which requires members to remove tariffs from 90 percent of goods, boosting trade across the continent from 2021 onwards. 74 75 Namibia is deeply integrated with SACU, hence much of its trade policy is governed by SACU’s regulations and tariffs. South Africa’s outsized influence in the customs union gives that country significant sway over its regulations. This raises some trade-diversion concerns for Namibia and other member countries, as South African industrial policy is increasingly geared towards import substitution through increasing tariffs, levied even on intermediate goods like aluminum and steel. This policy might force other SACU member countries to import higher-cost goods from South Africa rather than cheaper goods from other countries subject to SACU tariffs. 76 However, under SACU regulations Namibia retains its rights to set-up its own tariff board, which can circumvent any unfavorable tariffs imposed via SACU. Furthermore, the SACU arrangement provides its members the option to offer infant industry protection for an industry that is less than eight years of age and
Figure 55: Trade policy indicators for Namibia
A. Mean tariff rate (%), all products B. Weighted avg. tariff rate (%), all products
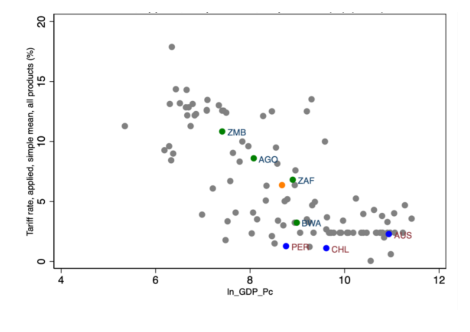
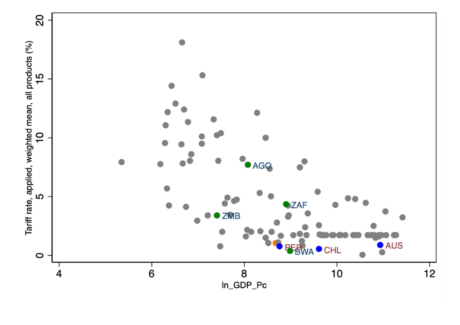
C. Tariff rates and imports over time D. Complexity of tariffs (1-7, worst)
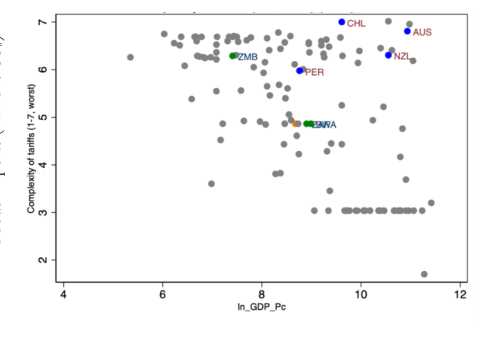
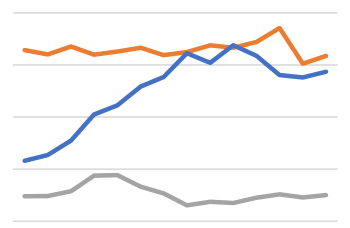
Panel E – Prevalence of Non-Tariff Barriers (1-7)
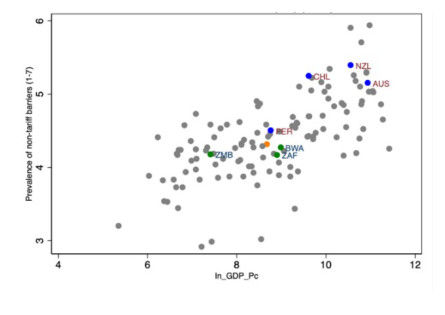
Namibia taxes various exports in livestock, minerals, and other primary commodities, with the aim of encouraging beneficiation and industrialization. 80 The government also directs certain exporters to cater to the domestic demand before offering their products for exports. For example, in order to export one live sheep, a farmer needs to supply six sheep in the Namibian market. 81 Despite these restrictions, these primary commodities represent a large proportion of Namibian exports.
Namibia’s imports have been declining since 2014, most likely due to balance of payments pressures from falling commodity prices, not trade policy barriers, which impose relatively low effective tariffs for imports (Figure 55, Panel A and B). For example, the weighted average tariff for 2018 is lower than for regional peers and in line with its international peers. Furthermore, Namibian effective tariffs have been relatively constant over the last decade (Panel C), while imports trended upwards until 2014 and downwards thereafter. Additionally, tariff-complexity (Panel D) and non-tariff barriers to trade (Panel E) in Namibia are low and in line with its regional peers, even if lower than international peers.
On balance, the data does not suggest that trade regulation is particularly binding to growth in Namibia. Tariffs for imports are not particularly high. Some barriers to exports are also present, but firms in the primary sector are largely able to bypass them. While South Africa’s influence over SACU may eventually lead to a sub-optimal tariff structure for Namibia, Namibia has the option of setting up its own tariff board according to SACU regulation. All things considered, there is little evidence to suggest that trade policy is a major constraint economic development.
4.3.3 Labor Regulations As documented by domestic and international studies, Namibia’s labor market has considerable slack. The country’s labor force participation rate is roughly 60%, lower than all regional and international peers (Figure 56, Panel A) and lower than 80% of all countries with over a million inhabitants covered by ILO data. Meanwhile, the strict unemployment rate of 20% (Figure 56, Panel B) is a rate that is
also higher than all regional and international peers. The overall employment rate (Figure 56, Panel C) is also exceptionally low, at 47%.
Labor regulations do not seem to be a driver of the considerable slack in the labor market. In the most recent World Bank Enterprise Survey (2014), just 1% of firms reported that labor regulations are their main obstacle for growth and just 4% of firms reported that they are a major constraint. Both percentages are at or below the sub-Saharan average and well below the average for all countries covered by the survey. This is consistent with the qualitative findings coming from Growth Lab’s consultations with private sector firms, where the issue of labor regulation was only raised for certain types of foreign workers.
Figure 56: Namibia’s labor market (selected indicators)
A. Labor Force Participation Rate (%) B. Unemployment Rate (%)
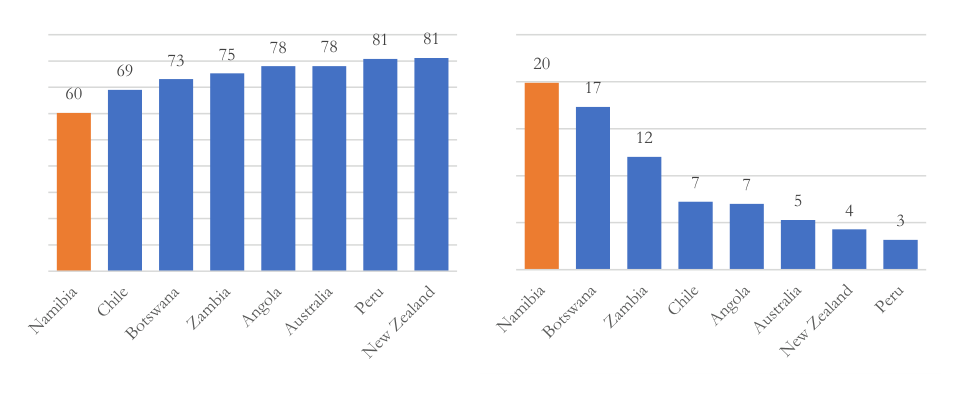
C. Employment Rate (%)
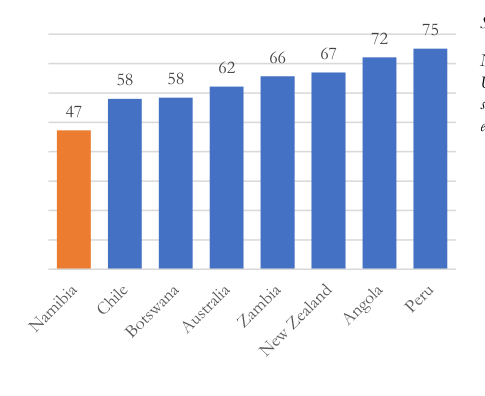
This is not surprising, given the degree of labor market flexibility. For instance, Namibia does not have a national minimum wage, 82 although a commission has been recently created to spearhead its possible introduction. 83 At the time of writing, salary minimums may be set in collective agreements for specific industries like mining, construction, agriculture, security, and domestic work, which have minimum wages of US$ 0.5/hour, 84 US$ 0.6/hour, 85 US$ 0.2/hour, 86 US$ 0.6/hour, 87 and US$ 0.6/hour, 88 respectively. These wage rates are comparable to Namibia’s African peers with the only exception of South Africa, and are significantly lower than Peru, Chile, New Zealand, and Australia (Figure 57).
Figure 57: Minimum Wages (US$ per hour)
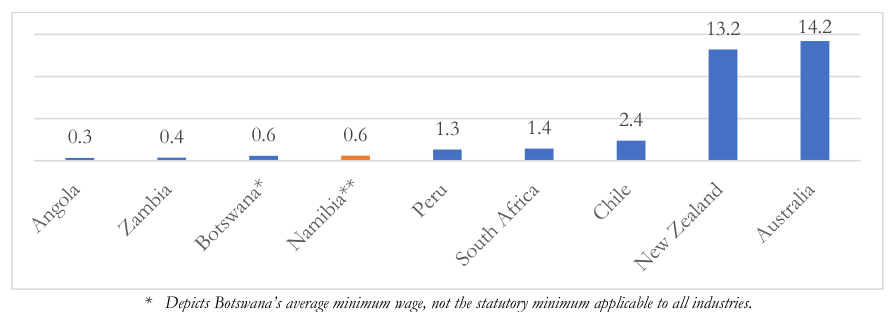
Namibia’s labor market regulation is also well positioned in the most recent Global Competitiveness Indices (2018). The country’s overall rank is 64/100 (100 being best), ahead of Chile, South Africa, Botswana, Peru, Zambia, and Angola (Figure 58, Panel A). Namibia also is well ranked in several subindices, including taxes on labor (Panel B), redundancy costs (Panel C), hiring and firing practices (Panel D) and cooperation in labor-employer relations (Panel E).
These sub-rankings are also consistent with the Growth Lab’s consultations with authorities and private sector stakeholders. As Figure 59 shows, labor regulation did come up frequently in interviews, but around half of the mentions were neutral, not negative. This is the case because while labor disputes do occur in Namibia – most recently the month-long workers strike at Shoprite, the South African retail chain – they are usually resolved successfully. Government and in particular the Ministry of Labor typically facilitates negotiations and encourages dialogue between the parties. The parties
interviewed largely agreed that government has a generally pragmatic approach and does not overwhelmingly side with either labor or businesses in these disputes.
Namibia only ranks poorly in the indicator for Ease of hiring foreign labor (Figure 58, Panel F), with a score of 3/7 (seven being best), which lags all regional peers and all international ones with the sole exception of Australia. That ranking is consistent with Namibia’s immigration policies, which poses relevant restrictions to hiring foreign labor. At the time of writing, foreigners must obtain a work visa to be legally employed in Namibia for more than 6 months, pursuant to Section 27 of the Immigration Control Act from 1993. Work visas last for 1-3 years, are renewable on a discretionary basis, take 3-6 months to be processed, and must be obtained prior to arrival to Namibia. 89 90 In addition to the standard requirements, the application requires a police certificate, medical certificate, and sometimes radiological report from the employee. It also requires proof that the vacancy was advertised in the Namibian press and that the position has a local understudy to shadow the work and pick up the skills of the foreigner. Work engagements lasting less than 6 months (even unpaid volunteer work) require a different kind of work visa, which has its own set of requirements.
Figure 58: Labor Market Regulations in the Global Competitiveness Index
A. Overall Labor Market Regulation B. Total Tax on Labor
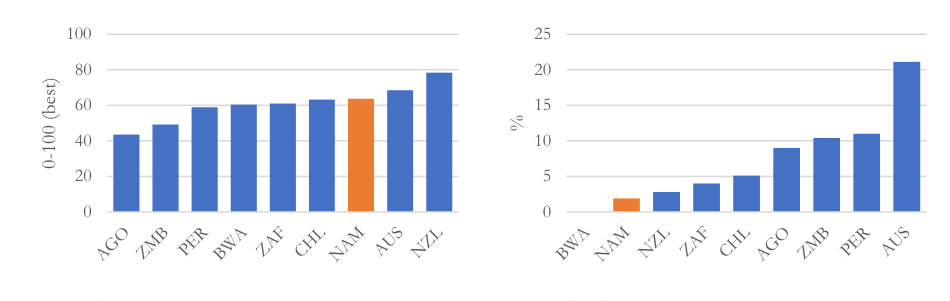
C. Labor-employer Cooperation D. Redundancy Cost (Weeks of Salary)
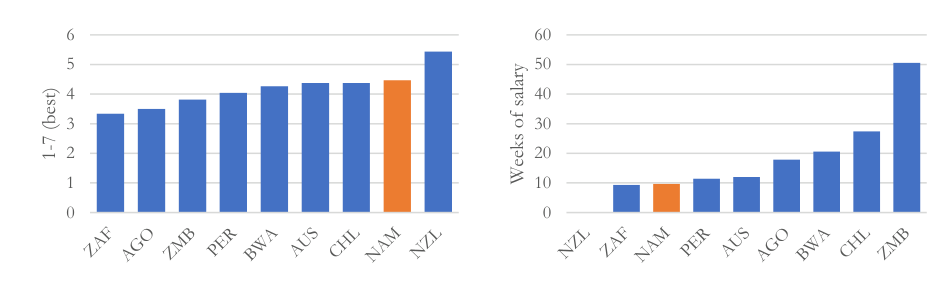
E. Hiring and Firing Practices F. Ease of Hiring Foreign Labor
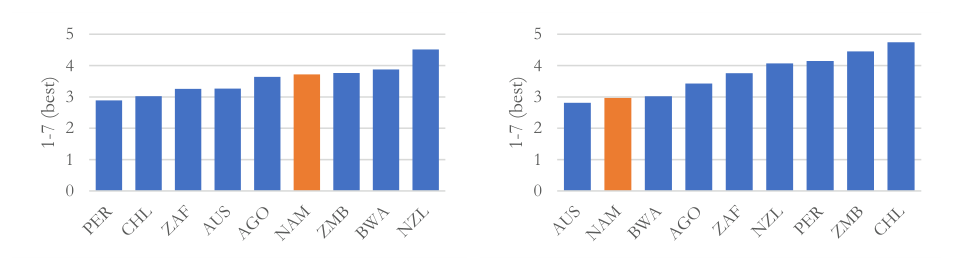
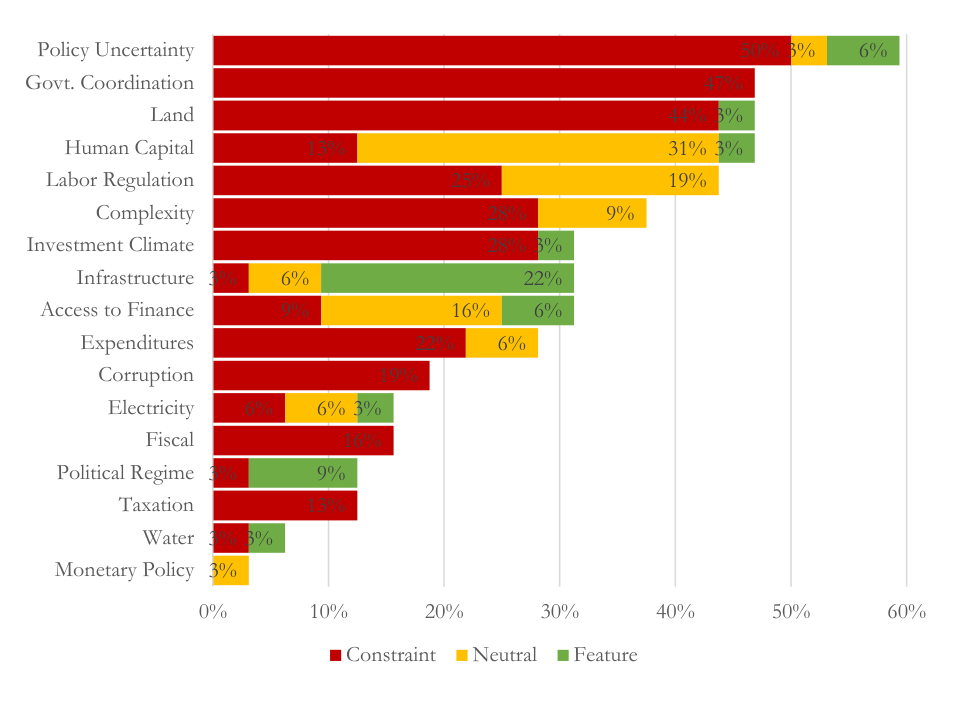
The 2009 Namibian Business and Investment Climate Survey (NamBIC) found that attracting skilled labor (Namibian or otherwise) was the greatest obstacle to growth for large and medium businesses
and that obtaining work permits for foreigners was the most challenging regulation. The same survey from 2013 suggested “things had improved but not by much.” 91 In a stakeholder interview with a high-skill services firm, the firm echoed that hiring foreign labor is “cumbersome, but not impossible,” citing that it takes a “lot of hours.” A second high-skill services firm echoed that bringing in highly skilled labor was hard, in part because of the difficulties in regularizing the status of the spouses of workers.
While labor market regulations in general do not seem to be a constraint to growth for existing economic activities, the specific restrictions to hiring and retaining foreign labor might be particularly binding for prospective diversification opportunities. If that is the case, the output from consultations with domestic stakeholders might be biased, as firms not intensive in these types of missing skills would be more likely to thrive. Moreover, as is argued elsewhere in this report, restrictions to foreign labor might be preventing Namibia from obtaining the complementary skills and know-how needed to unleash opportunities for Namibians at all skill levels and to successfully develop prospective industries with high potential.
While labor market regulations in general do not seem to be a constraint for existing economic in Namibia, the specific restrictions to hiring and retaining foreign labor might be particularly binding for more industries that rely on relatively scarce specialized knowhow. Moreover, restrictions to foreign labor might be preventing Namibia from obtaining the complementary skills and knowhow needed to successfully pursue diversification opportunities with high potential. That consideration is particularly relevant given the challenges on this front outlined in Section 4.
4.3.4 Policy uncertainty Uncertainty over the direction of economic policy is often cited by members of Namibia’s civil society and private sector as an inhibitor to economic growth, and in particular, an inhibitor to foreign direct investment (FDI). For instance, the Namibia Quarterly Economic Review (QER) compiled by the Institute for Public Policy Research (IPPR), claims that certain recent legislative proposals have “effectively hung out a sign to foreign investors saying, ‘No entry: please come back in five years’” (Q1 2020 report). Although the QER does not phrase its arguments in terms of “policy uncertainty”, they cite the lack of clarity around key policies (discussed below) as the main driver for the alleged deterioration in Namibia’s attractiveness as an investment destination. “Who can trust Government when it has flip-flopped so much over the past five years?” (Q1 2020 report).
Policy uncertainty has several dimensions. First, it can refer to uncertainty over the broad marketorientation of policies and the potential of private agents to appropriate the economic returns derived from their investments. Second, it can refer to uncertainty surrounding the practical implementation of policy and differences that might exist between the normative law and what positively occurs in practice. Third, it can refer to the difficulty of keeping track of the various draft versions of important policies that have circulated in recent years. In this section, we will mostly focus on the first type of
uncertainty, although the second (and to a much lesser extent the third) are also important and came up during the Growth Lab’s interviews with private sector stakeholders.
For context, despite the perceptions of policy uncertainty surrounding appropriability, Namibia has a very strong track record as an investment destination and property rights. Unlike many regional peers and the developing world, Namibia doesn’t have a track record for expropriating large private investments nor systematically engaged in practices that amount to de facto expropriations, like changes to tax policy after large investments have been made. Although some indices aimed at approximating market friendliness like the Heritage Foundation’s Index of Economic Freedom rank Namibia below peers (Figure 60), the difference between Namibia and the average country is mostly explained by macro-fiscal issues unrelated to property rights and appropriability (Figure 61).
Figure 60: Heritage Foundation Index of Economic Freedom
Figure 61: Index components that explain difference from 2020 average ranking
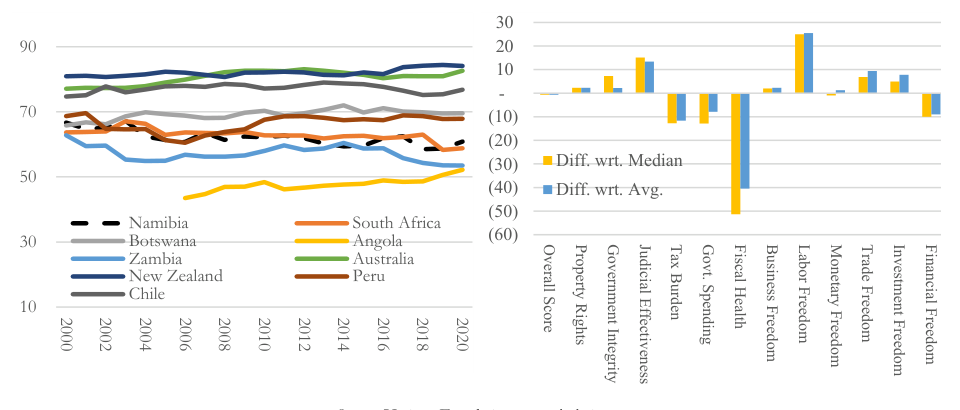
Likewise, Namibia’s ranking in the Fraser Institute’s Investment Attractiveness Index (IAI) for the mining sector has been slipping since the high in 2014. That decline was not driven by a deterioration in the quality of policy, but rather by a change in investors’ perception of Namibia’s mineral endowment. By construction, the IAI is a composite index of an underlying Policy Perceptions Index (PPI) and a Best Practices Mineral Potential Index (BPMPI), where the latter is weighted more heavily. Namibia’s ranking in the PPI has risen in recent years, overtaking Botswana in 2019 (Figure 62), but its ranking in the BPMPI has slipped, reflecting wearying enthusiasm for Namibia’s resource potential, likely influenced by the adverse price scenario faced by its main mineral resources (Figure 63).
In spite of these indexes, the perception of a deteriorating investment climate due to policy uncertainty is strong among a subset of private sector stakeholders interviewed by the Growth Lab. This perception is driven by a set of proposed or enacted policy changes introduced over the last decade. Based on statements made during qualitative interviews, the QER reports, other opinion publications and informal conversations, none seem to be as important as the New Equitable Economic Empowerment Framework (NEEEF) and the Namibia Investment Promotion Act (NIPA).
NEEEF was first introduced in 2011, but the policy has its roots in the 2000s in a similar legislative effort called the Transformation Economic and Social Empowerment Framework (TESEF), proposed by Prime Minister Nahas Angula in 2007 drawing from earlier efforts. The aim of the NEEEF is “to enact legislations providing directly or indirectly for the advancement of persons within Namibia who have been socially, economically or educationally disadvantaged by past discriminatory laws or practices, or for the implementation of policies and programmes aimed at redressing social, economic or educational imbalances in the Namibian society arising out of past discriminatory laws or practices.” 92 Specifically, the government seeks to “use all legal forms of leverage at its disposal (such as public procurement and licensing) to encourage firms to bring previously disadvantaged Namibian shareholders on board, to train and promote them into senior management positions, to use procurement to stimulate more local business, and to promote the well-being of the communities in which they operate.” 93
Figure 62: Fraser Institute PPI Figure 63: Fraser Institute BPMPI
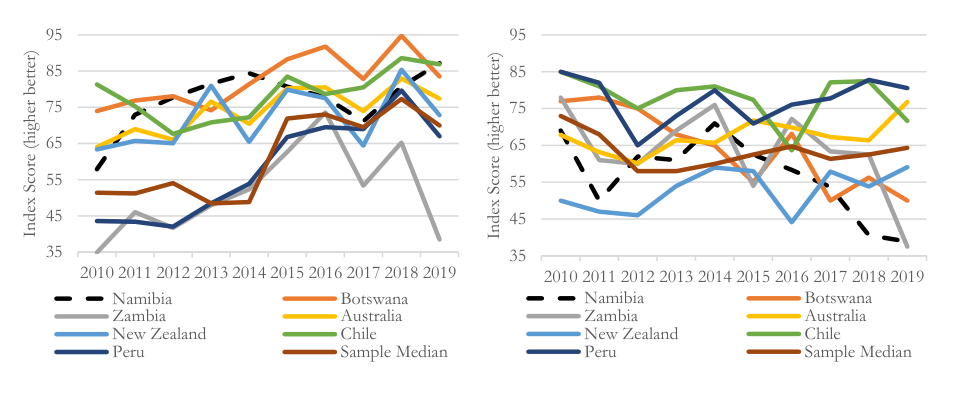
The first iteration of Namibia’s NEEEF proposed a scorecard to assign firms a tally based on their compliance with a number of key pillars. The proposal was similar – but relatively more straightforward – than its South African equivalent, called the Broad-Based Black Economic Empowerment (BBBEE) program. Under the Namibian proposal, firms would be assessed on their performance in major areas like ownership, management, and training by previously disadvantaged Namibians. In February 2016, and then again in 2017, NEEEF took a central role in the policy debate when the government circulated a new draft bill which introduced major changes, including the requirement that at least 25% of the equity of all firms must be held by previously disadvantaged Namibians, raising concerns in segments of the business community. 94 Two years later, in April 2018, President Geingob stated that the 25% equity requirement would be removed from the bill, stressing that government “understood concerns raised by the private sector on NEEEF, in particular on the ownership pillar.” 95 In early 2020, the government circulated a new version of the NEEEF which excludes the 25% ownership requirement. As of writing this report, it has not yet become law.
Critics of the policy claim that if implemented, NEEEF would “cast a huge cloud of doubt over the Namibian investment environment and therefore do real damage during that period.” 96 It is likely, that given the nature of its rollout and public discussion, NEEEF has not only contributed to spur the first kind of policy uncertainty (relating to appropriability and the broad market orientation of the economy), but also the second kind (relating to practical implementation) and third (surrounding various versions of the bill).
Some private sector stakeholders likewise express concerns about NIPA, a proposed policy framework for investments which has existed in various draft forms since 2016 and would supersede the Foreign Investment Act (FIA) of 1990. The Growth Lab’s overarching assessment of the bill, comprised in the Promotion of Foreign Direct Investment Policy Memo, is that the bill explicitly grants increasing discretionary powers, while removing explicit guarantees to investors from the FIA. For instance, the bill indicates that the minister can fully or partially restrict certain sectors from FDI and approve or deny foreign managers and decide on their work permit status. The draft bill also removes explicit guarantees for the acquisition of foreign currency from the FIA, introduces ambiguous language for compensation for expropriation, and has more stringent wording regarding foreign labor. Stakeholders concerned with a change in the general market-orientation of policies cite NIPA as an example of such a potential policy backtracking.
On a smaller scale, there has been some uncertainty on the future of tax policy for the mining sector in recent years, which also belong to the first kind of uncertainty surrounding appropriability. In the budget speech for the 2019/2020 fiscal year, it was proposed that royalties would not be deductible for income tax purposes, which effectively amounts to a tax increase, and that export levies for nondiamond mining and an increase of 2% to 15% for dimension stone export levies to countries outside
the EU. Later, a moratorium was placed on the non-deductibility clause, pending consultations with stakeholders and comparative studies of Namibia’s tax regime.
Research on the negative impacts of growth and investment of policy uncertainty dates back to Bernanke (1983), who argued that uncertainty incentivizes firms to postpone investment and hiring decisions when projects are costly to unwind and hiring and firing is costly. The literature specifically on policy uncertainty (for instance, Friedman (1968), Rodrik (1991), Higgs (1997), and Hassett and Metcalf (1999)) documents the negative economic effects of fiscal and monetary policy uncertainty as well as uncertainty over future regulation. Nevertheless, the empirical research on the impacts of policy uncertainty is relatively new, consisting mostly of text-search algorithms that identify instances of words that are intuitively linked with policy uncertainty.
Most interestingly, Ahir, Bloom and Furceri (2018) constructed a “World Uncertainty Index” (WUI) using a text-search algorithm to count instances of the words “uncertain”, “uncertainty” and “uncertainties” in the Economist Intelligence Unit’s quarterly country reports. The index covers 143 countries from 1996 onwards. As Figure 64 shows, the index peaks for Namibia in 3Q2016, 1Q2017, when discussions on the NEEEF were at the fore of public discussion and most recently in 3Q2020, with the COVID-19 pandemic. What the data shows, if anything, is that Namibia is not particularly different from most of its peers in terms of this kind of uncertainty and is certainly not an outlier.
Figure 64: World Policy Uncertainty Index for Namibia and peers
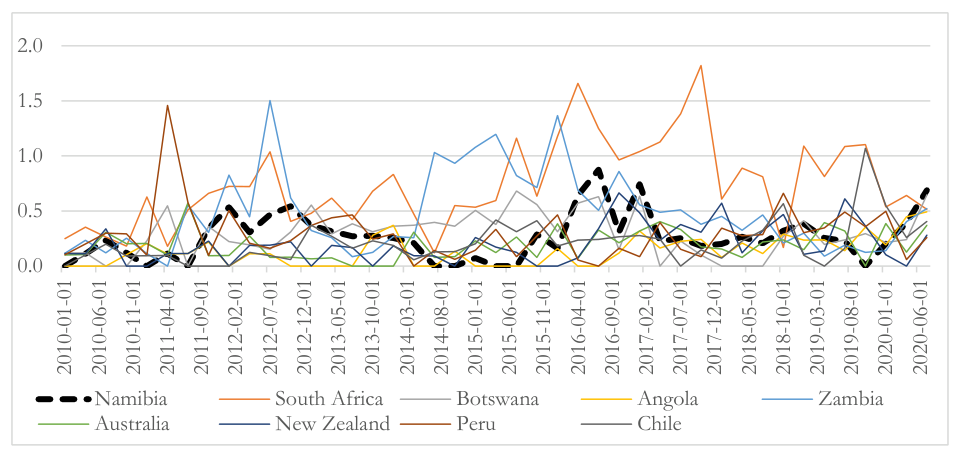
The fact that Namibia does not have an unusually high economic policy uncertainty – at least as captured by the WUI – is consistent with the relative stability of Namibia’s political system. According
to the World Bank’s political stability index, Namibia is more stable than Chile, Zambia, South Africa, Angola, and Peru and only lags Botswana, Australia and New Zealand among comparator countries.
On balance, while uncertainty surrounding the NEEEF, NIPA and certain elements of tax policy have weighed on Namibia’s attractiveness as an investment destination, our findings do not suggest that Namibia is more problematic than its peers on this dimension. That said, even if the evidence does not suggest that policy uncertainty is a binding constraint to the economy, added certainty on the direction and market-orientation of future policy may nevertheless help attract foreign direct investment and improve the country’s business climate. Given the historic recession the country is going through, improvements along any margin that help shore up investor confidence and increase Namibia’s attractiveness are likely to be beneficial.
4.4 Agglomeration of collective knowhow The accumulation of know-how is fundamental to the process of productive diversification and structural transformation. The process of development is driven by technological progress, which in turn depends on the accumulation of know-how or tacit knowledge (Hausmann, 2016). Tacit knowledge and knowhow – as opposed to more tangible knowledge embodied in tools and recipes – resides only in the brains of people and is obtained through imitation and repetition over time. As such, it is more difficult to acquire and harder to move around. Individuals, thus, will tend to specialize in specific capabilities, whereas the wealth of societies as a whole depends in their capacity to agglomerate different types of knowhow. As economies develop, societies acquire more and different capabilities to produce complex products and engage in different economic activities, being able to combine an assorted array of individual specializations through teamwork and cooperation.
The degree of knowledge agglomeration of a place can be inferred by observing the products and services it is able to make and can be approximated by economic complexity metrics. Given that knowhow is embedded in goods and services, and capabilities cannot be directly observed, it is possible to construct quantitative measures of the knowhow agglomeration of a place (the Economic Complexity Index or ECI) or embedded in a product (the Product Complexity Index or PCI) by observing patterns of production across places and time, using trade, value added or employment data. Places with large agglomerations of know-how will have a comparative advantage in producing not just more products (more diversity), but also products that on average fewer countries produce (less ubiquitous) (Figure 65). These places will show a higher ECI, having diversified over time into more complex products. High levels of ECI are not only correlated with higher levels of GDP per capita (Figure 66), but their prediction errors – the difference between the income per capita of a place and the one that it would correspond to its level of ECI – are informative of future growth dynamics (Hausmann, Hidalgo, et al, 2014).
Low levels of collective know-how or capabilities can be a binding constraint to economic growth. Relatively low knowhow agglomeration – as gathered in the ECI – can become a binding constraint to sustained and inclusive growth, as it indicates the country will not have many nearby complex products to which it can diversify into. In those cases, a significant share of the knowhow and productive capabilities required by the closets products and services will still be missing. That in turn demands stronger state capacity to overcome the coordination and information failures that are associated to the process of self-discovery (Hausmann & Rodrik, 2002).
The results of our complexity analysis in Namibia suggest that the country has a low agglomeration of knowhow and low connectedness. Applying the framework outlined above and using net-exports data from UN COMTRADE, we construct economic complexity metrics for Namibia to infer collective know-how and test for it as a binding constraint. The results indicate that Namibia not only has a low ECI but also does not have many complex diversification opportunities nearby. The export acceleration – driven by higher prices and market shares – recorded over the large 2000-2015 expansion was restricted to a few natural resources with very low shares of employment. That feature characterizes the growth patterns observed in Namibia and is at the core of the challenges the country has faced to promote inclusive growth and increase the standard of living of Namibians.
Figure 65: Diversity and average ubiquity (2018)
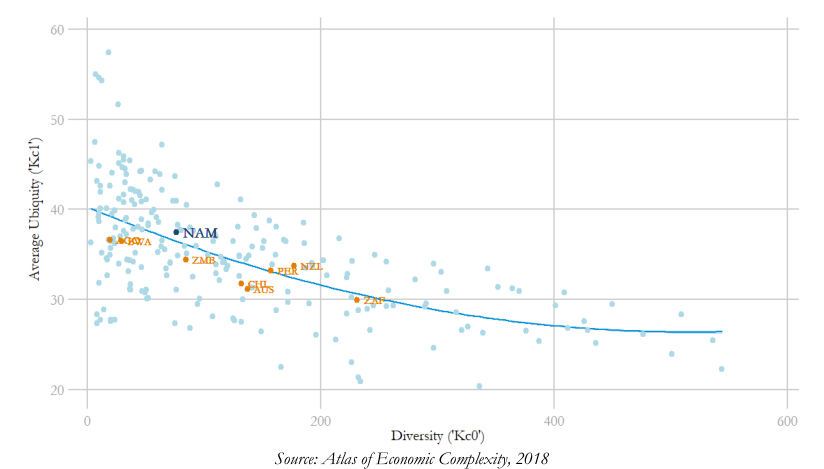
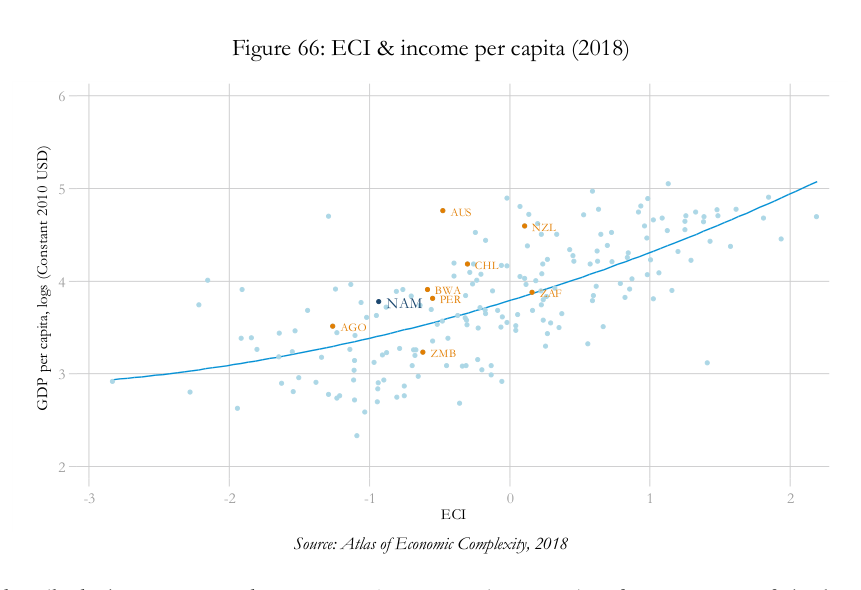
As described, the country underwent a major economic expansion for most part of the last two decades, mainly driven by the global commodity super cycle. Favorable terms of trade translated into an investment and export boom. Foreign direct investment (FDI) more than tripled between this same period and, until 2018, net exports multiplied by a factor of 7, driven mostly by higher demand for diamonds, copper, zinc, and gold, and outperforming most of its peers (Figure 67).
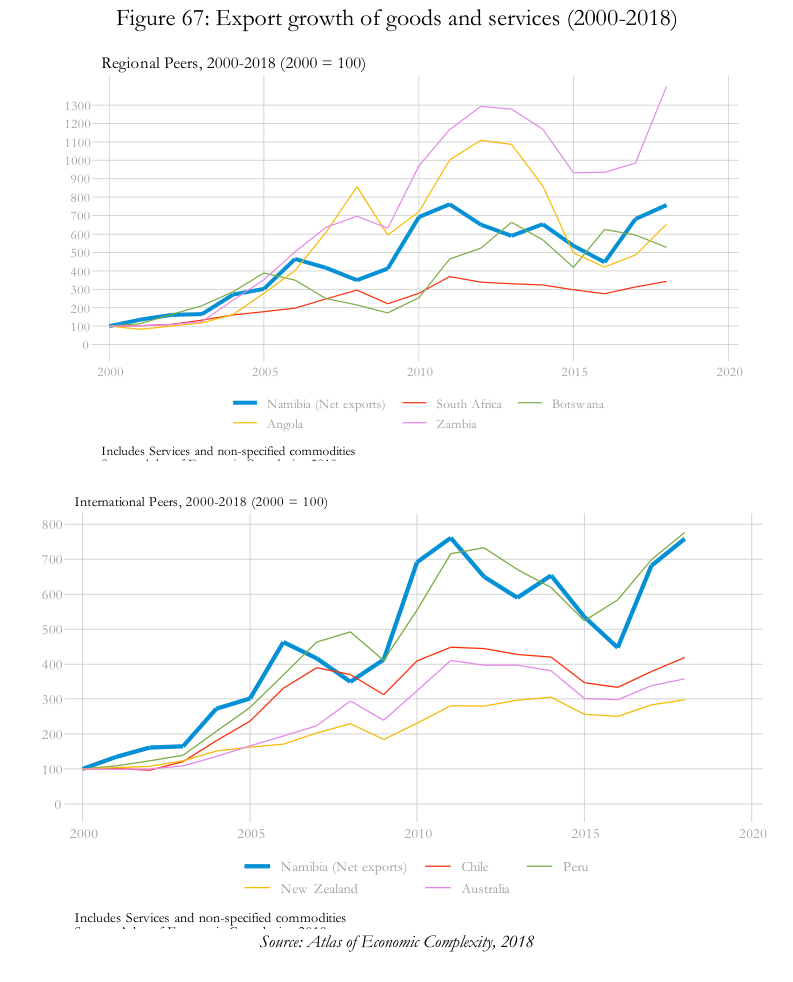
Once the commodity boom ended, GDP per capita contracted by 2.1% on average between 2015- 2019 – with a total loss of 8.1% in just four years – while investment went from 35% of GDP in 2014 to close to 10% in 2019. Although with an important recovery in the last two years, growth in exports has not been accompanied with substantive growth in market shares of its main products, with highly volatile trajectories (Figure 68). This trend highlights potential challenges around sustaining long periods of rapid and inclusive growth.
Figure 68: Namibia’s global market shares (2000-2018)
Figure 69: Economic Complexity Index, Namibia and peers (2018)
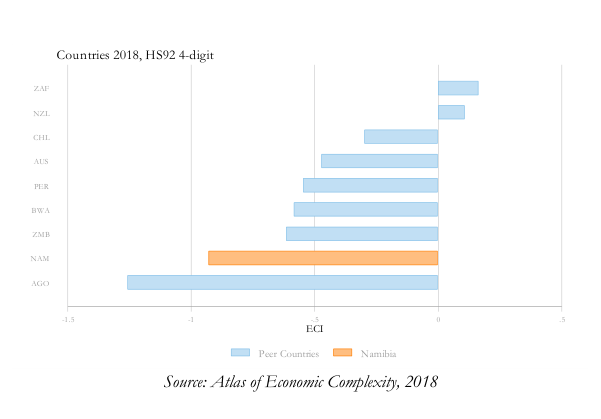
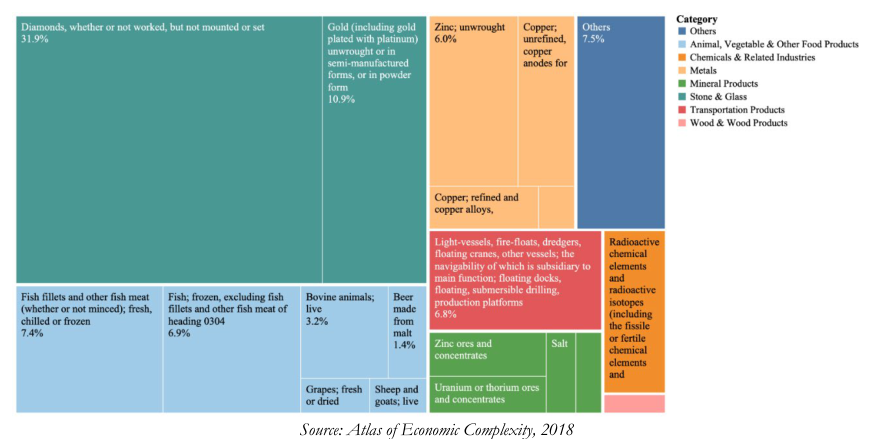
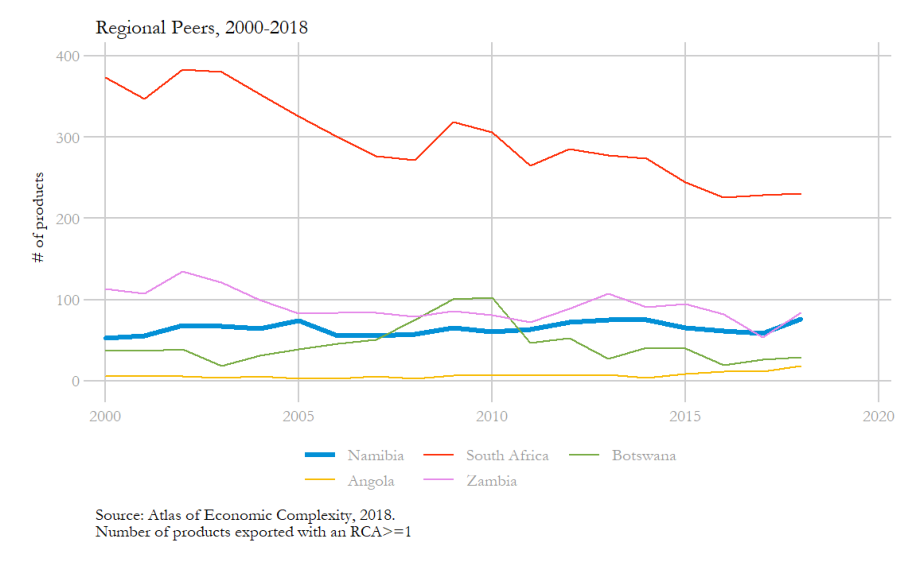
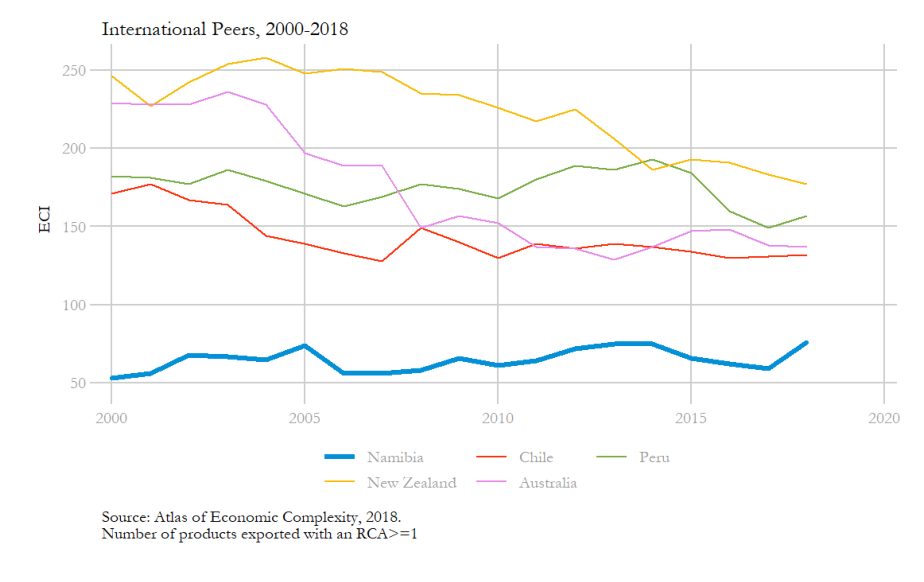
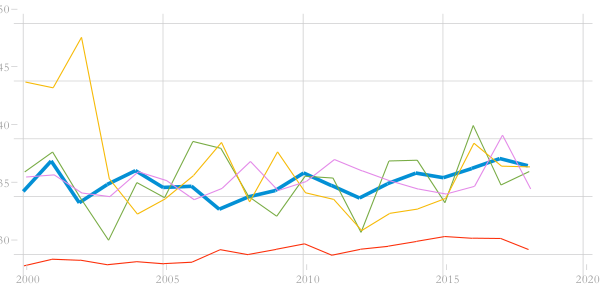
Over the previous decades, Namibia has been able to diversify into products which are adjacent to its exiting capabilities. As a matter of fact, the country has been able to diversify differentially more than the average country and more that most of its peers, given its current set of productive capabilities (Figure 74). Put in a different way, within the context of low ECI, the country has been able to materialize diversification opportunities by conquering adjacent products. This is supported by the fact that Namibia – within the limited set of options – has revealed its diversification capacities, by adding new products to its export basket.
Figure 74: Differential effect of density over the probability of jumping by location (2010-2018)*
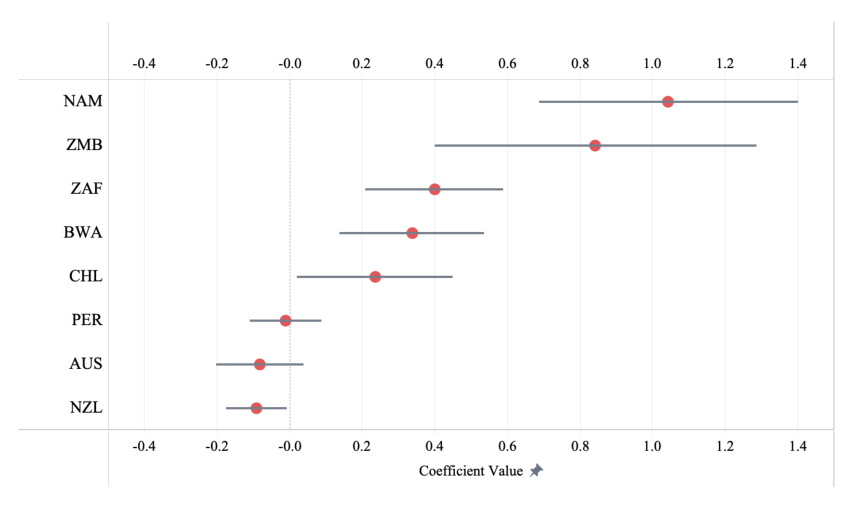
* We calculate the probability of ‘jumping’ into new products for the period 2010-2018 for Namibia and its peers, controlling for their position in the product space and product competitiveness. In particular, we run the following specification: jjjjjjjj iijj = ff(dddddddddddddd iiii , rrrrrr iiii , cccccccccccccc ii , cccccccccccccc ii _dddddddddddddd iiii ) , where Jump is a dichotomic variable that takes the value of 1 if in a period of 8 years the RCA of industry j in country i went from 0.25 or lower to 1 or greater than 1. The parameter of interest is , cccccccccccccc ii _dddddddddddddd iiii , which captures how related is the density of the country’s product to its diversification process over time vis a vis the average country. Thus, a statistically significant and positive coefficient indicates that the country has been able to jump differentially more than the average country.
The problem is that Namibia has very limited opportunities to diversity into, and these opportunities have a limited strategic value. Most of Namibian export products lie at the periphery of the product space and distant from each other, which leaves very few potential nearby jumps (Figure 75). Out of the products added since 2003, 95% of the value added corresponds to products with an average PCI lower than the global mean, mostly transport, metals, and stone products. 97 This is reinforced by the
relative increase in their average ubiquity since 2013. The country’s Complexity Outlook Index (COI), which captures the number of absent complex products that demand know-how and productive capabilities that are similar to those in place, shows that Namibia has few complex products within a short distance (Figure 76 and Figure 77). That feature is mirrored at a more granular level by the average density by export category, which is lower for Namibia for all export categories than for the average of its regional and international peers. All of these indicators suggest that productive diversification in Namibia might be steeper process than in peers, calling for a strategy that comprises progressive capability accumulation, targeted long jumps and state capacity to sort out market failures associated with the process of self-discovery.
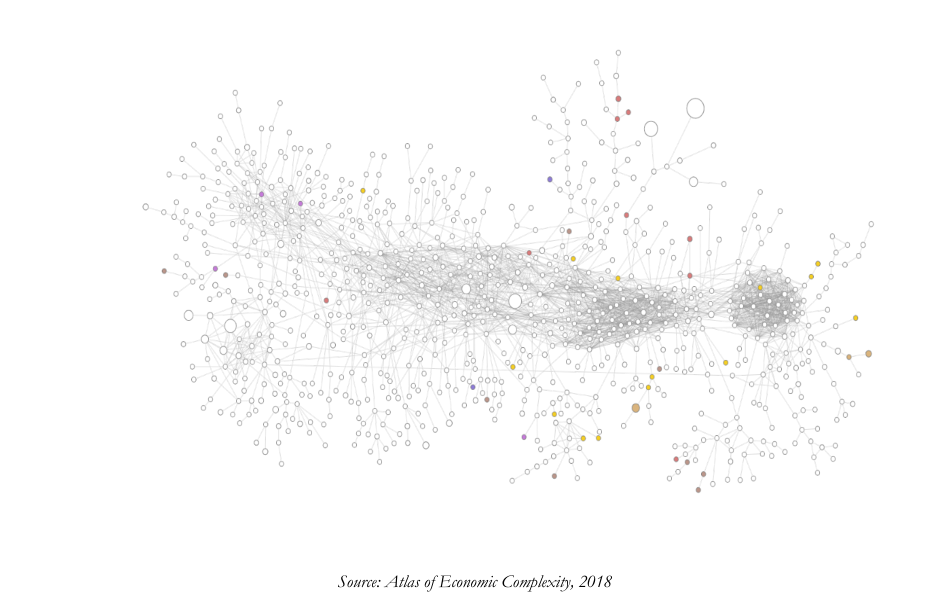
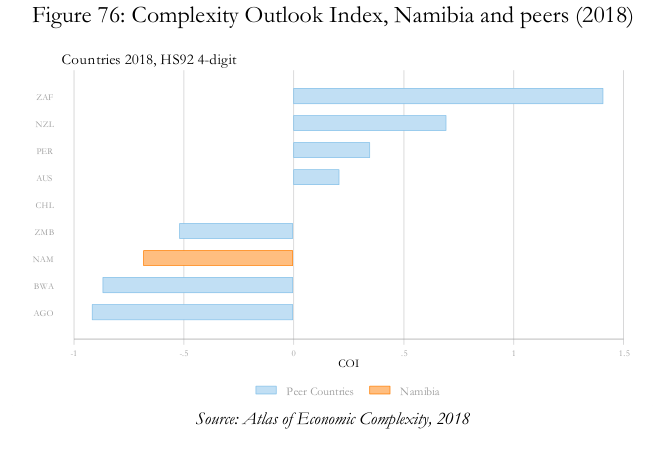
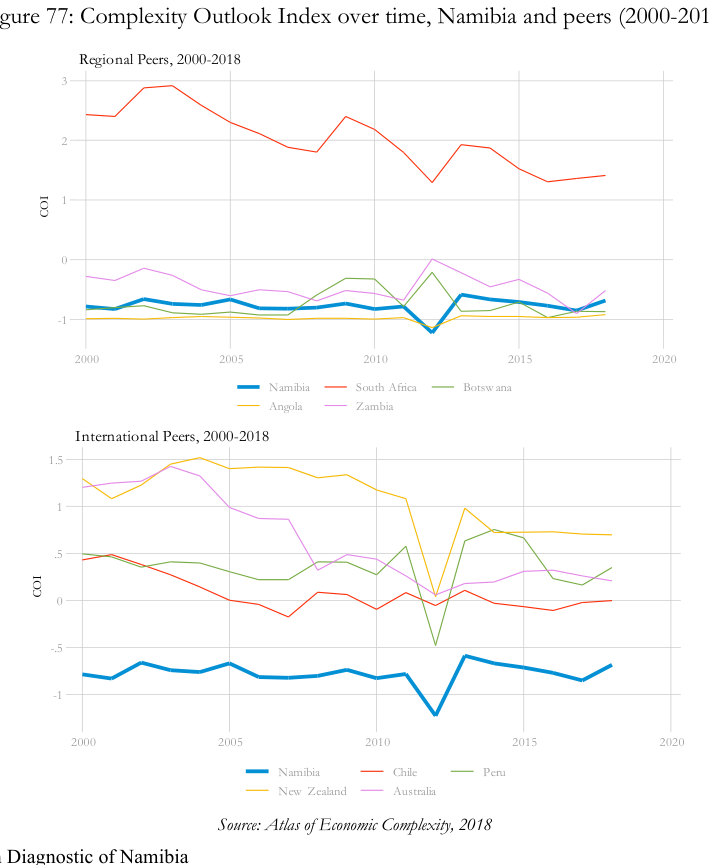
Given the evidence, it seems that low levels of collective know-how and few nearby opportunities to diversify into are acting as a binding constraint to economic growth for Namibia. Although the country was able to grow at substantial rates for most part of the last 2 decades, this has yet to prove to be both sustainable and inclusive, whereas most of the country still earns relatively low wages and has limited access to the formal private labor markets. Export’s have multiplied by 7 but this has been driven mostly by low complexity products, not gaining significant market share in any of them. Products which could add complexity to its export basket are far, thus could find it difficult to acquire new know-how given its current productive capabilities. Even if Namibia has been differentially been diversifying into nearby products, current opportunities are few, showing a problem of low connectedness which limits economic growth. A further of exploration of these challenges and a potential way forward to overcome them will be the focus of the forthcoming Economic Complexity Report .
5. Concluding remarks
National development is said to entail a four-fold transformation: A responsive state, capable public administration, equal treatment of its citizens and a productive economy. 98 Since independence, the progress that Namibia has made in political stability, state capacity inclusion has outperformed more veteran African neighbors and many developing countries. Successive democratic governments have made significant progress in dealing with the legacy of exclusion, making strides in improving access to essential public goods such as education and health services, developing roads, port and airport infrastructure and improving access to electricity and sanitized water.
The challenges still pending are related to the creation of a more productive and inclusive economy, that allows Namibians to access productive jobs with better wages and improve their standards of living. These challenges are reflected in extremely low labor participation, high unemployment, and a very small formal private market that provides employment for only one for every seventeen Namibians in the labor force.
The Namibian economy is still dominated by natural resources, predominantly mining and metals. Namibia organized well around these sectors and became a premium investment destination for foreign direct investment. That allowed the country to engine er a prolonged growth acceleration riding on the wave of the super-cycle in commodity prices that predominated between 2004-2015. The investment-driven boom – enhanced by a significant fiscal expansion – permeated towards the nontradable sector, which represent two-thirds of the Namibian economy and accounted for more than 90% of all the growth registered during the acceleration. The end of the super-commodity cycle led to an economic recession, as foreign direct investment in extractive industries fell-off worldwide and the government was forced to pursue a significant fiscal contraction. With the mining and mineral investment cycle completed, output in these sectors continued to grow but the non-tradable – in particular, Wholesale and Retail, Construction, and Transport and Storage, collapsed.
Going forward, the challenge for Namibia is how to engineer a sustained growth acceleration, that is inclusive in nature, within the context of fiscal consolidation. The Growth Diagnostic is an exercise aimed at identifying the most binding constraints to investment and growth in Namibia. Although the mechanics of the framework are run for the median sector of the economy, it is possible that these constraints are expressed in slightly different fashion across traditional sectors and potential new engines of growth.
With regards to traditional engines of growth such as natural resources, the slowdown in investment was not specific to Namibia, but rather a worldwide phenomenon. The drop in commodity prices generated a significant decline on the flows of direct investment to the sector worldwide. But commodity prices are known to be cyclical, and in particular those that are more relevant to Namibia – Diamonds, Uranium, Copper, Lead, Zinc and Gold – have already started to show signs of recovery. In order to take advantage of new investments opportunities, it is important that Namibia is able to maintain its status as a premier investment destination on the sector.
This implies dispelling potential investor perceptions regarding policy uncertainty – which may dampen interest – particularly, in a highly competitive post pandemic context. It also implies continuing to provide the high-quality infrastructure – roads, railroad, ports and air transportation facilities – required by these industries. Namibia’s logistical infrastructure is likely one of its biggest competitive advantages. However, a compromised fiscal outlook may threaten the capacity of the government to continue to safeguard these in the absence of strategic alternatives.
It should also be noted, that even though access to finance and access to land were not identified as active constraints at the moment, these appeared to be somewhat binding during the peak of the past investment boom and may become binding again if the country experiences a new period of sustained growth. The latent signals for access to finance are particularly of note, given the very low levels of domestic savings, which may further dependence on FDI to finance productive activities.
The binding constraints that are preventing Namibia from developing new engines of growth may be different in nature. The country has a significant shortage of productive knowhow, which manifest in low levels of economic complexity and economic complexity outlook. That in turn increases the demand for specialized state capacity to sort out and address coordination and information failures associated to the process of self-discovery. This process may imply four concurrent efforts. First, identifying viable economic sectors with high-potentially that could be credibly developed by redeploying existing capabilities. Second, safeguarding investor confidence with regards to the policy outlook and the transparency of the regulatory framework. Third, disentangling – through quantitative and qualitative research – unobservable sector-place specific constraints to productivity and collaboratively pursuing concrete policy responses to overcome these barriers. Fourth, systematically overcoming the significant specialized skills shortage which is currently constraining access to opportunity for Namibians at all skill levels and that is likely preventing the further development of prospective diversification opportunities.
These concluding thoughts aim to provide an initial approximation of how key elements of the Growth Diagnostic interact. Once the most binding constraints have been identified, the Growth Diagnostic exercise should focus on explaining why these issues have persisted and become an equilibrium. This phase of the process is fertile ground to strengthen the robustness of the analyses and gradually narrow the set of relevant hypotheses through active collaboration with domestic stakeholders and technical subject matter experts. This report, including these concluding remarks, are intended to be a starting point for that conversation.
6. References
“Application for temporary work permit or study permit.” https://www.namibiaembassyusa.org/page/application-for-temporary-work-permit-or-study-permit “Doing Business in Namibia: A Guide for UK Companies” (2014). Available at: https://assets.publishing.service.gov.uk/government/uploads/system/uploads/attachment_data/fil e/301482/Doing_Business_in_Namibia_2014.pdf “ILO lauds Namibia’s efforts in creating a minimum wage.” https://mol.gov.na/documents/53329/69998/Minimum+wage+Security+Industry.pdf/7104b9bacdd4-f277-d499-5aa8c99f1290 “Legal teeth for water regulator to determine price of bulk water.” https://economist.com.na/25172/general-news/legal-teeth-for-water-regulator-to-determine-priceof-bulk-water/ (2014). “Doing Business in Namibia: A Guide for UK Companies.” https://assets.publishing.service.gov.uk/government/uploads/system/uploads/attachment_data/fil e/301482/Doing_Business_in_Namibia_2014.pdf African Union. (2020). “Thirteenth extraordinary session on the AfCFTA: The Assembly of the Union adopts decision on the start of trading.” https://au.int/en/pressreleases/20201205/thirteenth-extraordinary-session-afcfta-assembly-unionadopts-decision-start AgriBank Green Scheme Information. Accessed from: https://agribank.com.na/page/greenscheme/ Bank of Namibia. (2020). “Enhancement of Work Visa System in Namibia to Boost Economic Growth and Development.” Accessed in November 2020.
Berg, A. & Ostry, J. (2011) Inequality and Unsustainable Growth: Two Sides of the Same Coin? IMF Staff Discussion Note SDN/11/08.
Brandt, Edgar. (2019). “New poultry import restrictions meant to grow local capacity.” https://neweralive.na/posts/new-poultry-import-restrictions-meant-to-grow-local-capacity Brueckner, M. & Lederman, D. (2015). Effects of Income Inequality on Aggregate Output. Policy Research Working Paper 7317, Latin America and the Caribbean Region Office of the Chief Economist, The World Bank.
Cingano, Federico (2016). Trends in Income Inequality and its Impact on Economic Growth. OECD Social, Employment and Migration Working Papers, No. 163, OECD Publishing.
Coady, D. & Dizioli, A. (2017). Income Inequality and Education Revisited: Persistence, Endogeneity, and Heterogeneity. IMF Working Paper WP/17/126.
Daniel Cohen & Laura Leker, 2014. “Health and Education: Another Look with the Proper Data” , Manuscript.
Daniel Cohen & Marcelo Soto, 2007. “Growth and human capital: good data, good results” , Journal of Economic Growth , Springer, vol. 12(1), pages 51-76.
Dotsey, M, Shigeru, F. &, Rudanko, L. (2017). Where Is Everybody? The Shrinking Labor Force Participation Rate. Economic Insights, Federal Reserve Bank of Philadelphia, vol. 2(4), pages 17-24, October.
Economist Intelligence Unit data & reports. Accessed from: https://country.eiu.com/article.aspx?articleid=1010500284&Country=Namibia&topic=Summary&s ubtopic=Basic+data Gargallo, Edward (2020). “Community Conservation and Land Use in Namibia: Visions, Expectations and Realities.” Government Gazette of the Republic of Namibia. (2015). Ministry of Labor, Industrial Relations and Employment Creation; No. 309. http://www.lac.org.na/laws/2015/5910.pdf Government Gazette of the Republic of Namibia. (2017). Ministry of Labor, Industrial Relations and Employment Creation; No. 239. https://mol.gov.na/documents/53329/69998/Minimum+wage+Security+Industry.pdf/7104b9bacdd4-f277-d499-5aa8c99f1290 Grant, Robert. (2016). “Namibian VAT and Income Tax Amendment Acts.” https://home.kpmg/na/en/home/insights/2016/01/namibian-vat-income-tax-amendmentacts.html Hausmann, R. & Klinger, B., 2006. Structural Transformation and Patterns of Comparative Advantage in the Product Space.

Hausmann, Ricardo. (2016). Economic Development and the Accumulation of Know-how. Welsh Economic Review. 24. 13-16.
Hidalgo, Cesar & Hausmann, Ricardo. (2009). The Building Blocks of Economic Complexity. Proceedings of the National Academy of Sciences of the United States of America. 106. 10570-5.
https://www.namibian.com.na/99110/read/Govt-appoints-minimum-wage-commission Iikela, Sakeus. (2021). “Willing Buyer Willing Seller To Stay.” https://www.namibian.com.na/207976/archive-read/Willing-buyer-willing-seller-to-stay Integrated Water Resources Management Plan for Namibia (2010). Accessed from: https://projectsportal.afdb.org/dataportal/VProject/show/P-NA-EAZ-001 Karuuombe, Marcy. (2021). “Govt appoints minimum wage commission.” Mayer, Susan E. (2010). The relationship between income inequality and inequality in schooling. Theory and Research in Education, 2010-03, Vol.8 (1), p.5-20.
Measuring the Information Society Report 2018—Volume 2. https://www.itu.int/en/ITUD/Statistics/Documents/publications/misr2018/MISR-2018-Vol-2- E.pdf Mongardini, J., Asonuma, T., Basdevant, O., Cuevas, A., Debrun, X., Engstrom, L., Flores Vazquez, I., Kramarenko, V., Leigh, L., Masson, P., & Verdier, G. (2013). “Chapter 3: Southern African Customs Union Revenue Volatility: Roots and Options for Mitigation”. In Building a Common Future in Southern Africa . USA: INTERNATIONAL MONETARY FUND. doi: https://doi.org/10.5089/9781616353995.071 Namibia Employment Work Permit. https://www.workvisanamibia.com/namibia-employmentwork-permit/ NamPort. https://www.namport.com.na/ports/welcome-to-the-port-of-walvis-bay/522/ Nyaungwa, Nyasha. (2017). “Namibia to make white-owned businesses sell 25 percent stakes to blacks.” Reuters. https://www.reuters.com/article/uk-namibia-economy-empowermentidUKKBN17F20I Office of the Prime Minister. “National Equitable Economic Empowerment Framework (NEEEF).” https://opm.gov.na/neeef Ostry, J., Berg, A, & Tsangarides, C. (2014). Redistribution, Inequality, and Growth. IMF Staff Discussion Note, SDN/14/02.
Privacy Shield Framework. “Namibia – Trade Barriers.” https://www.privacyshield.gov/article?id=Namibia-Trade-Barriers Psacharopoulos and Patrinos (2018). “Returns to Investment in Education: A Decennial Review of the Global Literature”. Available at: https://openknowledge.worldbank.org/bitstream/handle/10986/29672/WPS8402.pdf?sequence=1 &isAllowed=y#:~:text=The%20review%20shows%20that%20the,issues%20of%20financing%20an d%20equity PWC. (2020). “Australia – Taxes on Corporate Income Taxes.” https://taxsummaries.pwc.com/australia/corporate/taxes-on-corporate-income PWC. (2020). “Chile – Taxes on Corporate Income Taxes.” https://taxsummaries.pwc.com/chile/corporate/taxes-on-corporate-income PWC. (2020). “South Africa – Taxes on Corporate Income Taxes.” https://taxsummaries.pwc.com/south-africa/corporate/taxes-on-corporate-income PWC. (2021). Republic of Namibia: Taxes on corporate income. Accessed from: https://taxsummaries.pwc.com/republic-of-namibia/corporate/taxes-on-corporate-income RAND (2018), “China Belt and Road Initiative”. https://www.rand.org/content/dam/rand/pubs/research_reports/RR2600/RR2625/RAND_RR2 625.pdf
Renewable Energy iin Namibia. GIZ. https://www.giz.de/en/downloads/GBN_Sector%20Brief_Namibia_RenewableEnergy_E_WEB.p df consulted on March 12th, 2021.
SACU webpage: SACU Website http://www.sacu.int/ SADC webpage: SADC Website https://www.sadc.int/ Sen, Amartya (1999). Development as Freedom. New York: Oxford University Press.
The World Bank. (2020). Namibia Systematic Country Diagnostic (2020)
Tjitemisa, Kuzeeko. (2019). “Geingob confirms demise of NEEEF stake clause.” https://neweralive.na/posts/geingob-confirms-demise-of-neeef-stake-clause UNCTAD Trade Policy Framework; Namibia (2017). https://unctad.org/system/files/officialdocument/ditctncd2016d2_en.pdf USA Department of Commerce. “Namibia – Country Commercial Guide, Trade Agreements.” https://www.trade.gov/country-commercial-guides/namibia-trade-agreements USAID Land Links: Namibia. https://www.land-links.org/country-profile/namibia/#land van Seventeer, Dirk. 2014. A 2007 Social Accounting Matrix (SAM) for Namibia. Washington, DC: International Food Policy Research Institute (IFPRI). http://ebrary.ifpri.org/utils/getfile/collection/p15738coll2/id/128889/filename/129100.pdf Walvis Bay Corridor Group. http://www.wbcg.com.na/
Data References
Ahir, Hites and Bloom, Nicholas and Furceri, Davide, The World Uncertainty Index (October 29, 2018). Available at: https://papers.ssrn.com/sol3/papers.cfm?abstract_id=3275033 Atlas of Economic Complexity, Center for International Development Bank of Namibia (2020).
Bank of Namibia (2020). Financial Stability Report. Accessed from: https://www.bon.com.na/Publications/Financial-Stability-Reports.aspx BoP Statistics (2020). The International Monetary Fund.
Cirrus Capital Data Cohen-Soto-Leker dataset. (2014). “Growth and human capital: good data, good results.”
Fraser Institute’s Investment Attractiveness Index (IAI)
FRED (2020).
Global Petrol Prices. globalpetrolprices.com Global Water Intelligence Growth Lab Stakeholder Interviews, Dec 2020 – February 2021 Heritage Foundation Policy Uncertainty Index ILO Natlex page for Namibia ILOSTAT IMF (2019). 2019 Article IV Consultation – Press Release and Staff Report. September 2019, IMF.
Input-output matrix prepared by van Seventeer (2007).
International Air Transport Association (IATA). Accessed from: https://www.iata.org/ International Finance Statistics (2020). The International Monetary Fund.
International Food Policy Research Institute (IFPRI). 2014. Namibia Social Accounting Matrix (SAM), 2007. Washington, DC: International Food Policy Research Institute (IFPRI) [dataset].
IPPR. Namibia Quarterly Economic Review Land Use Survey, 2018 Ministry of Finance, Namibia (2020).
Namibia Business and Investment Climate Survey 2014 NSA (2019). Labor Force Survey, 2018.
OECD Electricity Data
PALMS education data 2018.
Population and Housing Census, 2011 S&P Capital IQ (2020).
Statista Business Data Platform. Accessed from: https://www.statista.com/ Trading Economics. Tradingeconomics.com UN Aquastat UNCTADstat (2020), UNCTAD.
World Bank Doing Business Indicators. Access from: https://www.doingbusiness.org/en/doingbusiness World Bank Enterprise Surveys. Access from: https://www.enterprisesurveys.org/en/enterprisesurveys World Bank World Development Indicators. Access from: https://databank.worldbank.org/source/world-development-indicators World Development Indicators (2020). The World Bank.
World Economic Forum Global Competitiveness Indices. Accessed from: https://reports.weforum.org/global-competitiveness-report-2018/