Transcripción completa del PDF reformateada para lectura web. Descargar PDF original para tablas, figuras y referencias.
Carlos A. Molina Instituto de Estudios Superiores de Administración, IESA Caracas, Venezuela carlos.molina@iesa.edu.ve Miguel A. Santos Instituto de Estudios Superiores
de Administración, IESA Caracas, Venezuela miguel.santos@iesa.edu.ve ABSTRACT This case study presents a dilemma situation on how to determine the discount rate for cash flows in places where the country risk perceived by investors differs considerably from the country’s sovereign debt premiums. Specifically, we present the case of TELMEX, the Mexican telecom corporation, valuing and presenting a bid offer for CANTV, the Venezuelan telecom corporation. Venezuelan capital markets and sovereign debt premiums have a lower correlation than those present in other Latin American and emerging markets. In this case and its study guide, we review the existing literature and propose a new and comprehensive methodology for the estimation of discount rates in the Venezuelan case, incorporating the difference in stock market volatilities into the country risk consideration. The proposed solution can be exported to other emerging markets with low correlations between their sovereign debt premiums and their internal capital markets.
Key words : discount rate, cost of capital, cost of equity, country risk premium, sovereign debt, Latin America, cash flow valuation.
This case study does not intend to make a value judgment on the acquisition offer made by Telmex for a block of Cantv shares, but, simply, to outline the Venezuelan situation as an investment scenario for an international company and to calculate the respective investment risk. The case is based strictly on public information. The name Alfredo Ramos, and the circumstances mentioned in this study are fictitious.
The authors thank Hector Ramos and Luis A. Grau for their assistance in research, as well as the judges of the IESA’s Case Studies Contest.
RESUMEN Este caso de estudio presenta una situación de dilema en cómo determinar la tasa de descuento para flujos de caja en sitios donde el riesgo país percibido por los inversionistas difiere considerablemente de las primas de la deuda soberana del país. Específicamente, presentamos el caso de TELMEX, la corporación mexicana de telecomunicaciones, valorando y presentando una oferta para adquirir CANTV, la empresa venezolana de telecomunicaciones. El mercado de capitales y las primas de la deuda soberana de Venezuela tienen correlaciones más bajas que las que se encuentran en otros mercados latinoamericanos y emergentes. En este caso y su guía de estudio, nosotros revisamos la literatura existente y proponemos una metodología nueva y comprehensiva para la estimación de tasas de descuento en el caso venezolano, incorporando el diferencial en las volatilidades de los mercados de valores en la consideración del riesgo país. La solución propuesta puede ser exportada a otros mercados emergentes con correlaciones bajas entre sus primas de deuda soberana y sus mercados de capitales internos.
Palabras clave : tasa de descuento, costo de capital, rendimiento exigido, prima de riesgo país, deuda soberana, Latinoamérica, valoración de flujos de caja.
1. INTRODUCTION Alfredo Ramos, CFO of Telmex-America Movil, early one April morning in 2006, began his day trying to quantify the risk of one of the most volatile countries in Latin America. He pondered on whether to apply the best known and widely used techniques to calculate discount rates in emerging markets, or comply with the demands of the Board of Directors of the company, which in his opinion were based more on the experience and intuition of its members.
Alfredo graduated as a Telecommunications Engineer from one of the most prestigious universities in Mexico, and in 1997 was among the first of his MBA class in Harvard. Since then, he has had a successful career as an executive in the investment area of one of the most powerful economic groups of the region, Telmex-America Movil in Mexico, competitor in the Latin American market of Telefonica, the Spanish giant telecommunications company.
Since the beginning of 2006, the group had been analyzing the possible acquisition of a block of shares (28.51%) of Cantv, the biggest telecommunications company in Venezuela. Verizon, a US company, was the owner of this block of shares.
Alfredo was not worried about the Cantv cash flow projection. His team had already prepared a detailed financial analysis of the Venezuelan company performance for the previous five years, and had also made a projection of the cash flow for the next five years. The report from his work-team included also the main conclusions from research reports that various important investment banks had drawn up on Cantv, as well as a comparison between internal projections and market consensus.
Alfredo’s main concern lay on how to calculate the discount rate that he should recommend to the Telmex Board of Directors in order to evaluate the block of shares and proceed to make Verizon an offer.
Cantv is the main provider of telecommunications services in Venezuela. Its product range and services include various types of telecommunication interconnections, including long distance communication, national and international, public telephones, rural and mobiles, beepers, community communication centers, private networks, data transmission, information directories and different services of added value, throughout Venezuela.
Cantv was founded in 1930, when Felix Guerrero obtained a concession from the Venezuelan government to build and exploit a telephone network in the different states of the country. Progressively, Mr. Guerrero acquired different private telephone companies that operated throughout the country. In 1950, the Venezuelan government bought all the shares of the private companies operating in this sector and began a nationalization process, which was completed in 1973.
By 1990, Cantv presented numerous operating deficiencies and technological obsolescence, only satisfying 45.5% of demand, and with a telephone density of 7.2 lines per 100 inhabitants. Besides, it was facing a deficit of more than US$ 1 billion. It was evident that Cantv needed a significant investment in order to modernize and equip the company; only possible if the 1973 nationalization was reverted.
Cantv was re-privatized in 1991, with 40% of the shares put out to international tender. As a result, in December of that same year, Venworld Telecom consortium acquired the block of shares submitted . This operation cost US$1,885 million.
From that moment, Venworld assumed control of the Cantv operations under the terms set forth in the assignment agreement signed with the Republic of Venezuela. Among the consortium that comprised Venworld were: GTE – USA; Telefonica – Spain; Electricidad de Caracas – Venezuela; the Venezuelan group, Mercantil Servicios Financieros; and AT&T, the giant telecommunications company of the United States. The group was headed by GTE.
Assignment terms contemplated an initial period of 35 years, with an extension period of 20 additional years. It also established that Cantv would be the exclusive supplier of local as well as long distance (national and international) communication services until 2000. At the same time, the company undertook to accomplish goals of expansion and improvement in services, to be supervised by the regulatory organism of the sector in Venezuela, the National Telecommunications Commission (Conatel).
As a consequence of the total opening of telecommunications in Venezuela, in 2000, Cantv began a corporate integration process with its then affiliated companies: Movilnet
(Cellular telephones), Cantv.net (internet provider) and Caveguias (information services, printed and electronic directories). With these companies, Cantv formed a unique front to make use of operative synergies and offer clients integral solutions for their communications needs. In 2006, it was the leading provider of telecommunication services in Venezuela, with more than 3.1 million subscribers of fixed line telephones, more that 5.6 million of mobile lines (42% of the market), and more that 343,000 internet subscribers.
By February 2006, when Telmex was considering the investment in Cantv, the share composition had changed in relation to the privatization process in 1991. Verizon Communications Inc. was now the main shareholder with 28.5% of share capital. The Venezuelan State was among the other important shareholders with 6.6% of the total shares (Class B); employees, retired workers and employee retirement funds with 6.7% (Class C), while the remaining 58.2% were in the hands of the public through the Caracas Stock Exchange and ADRs in the NYSE.
Alfredo had asked his corporate finance team in Mexico to collect and process all available information on Cantv, including the information provided by the company itself as well as by the investment bank reports on Cantv. Appendices 1A, 1B and 1C (expressed in US-dollars) show the results of the analysis of the information collected from all the sources:
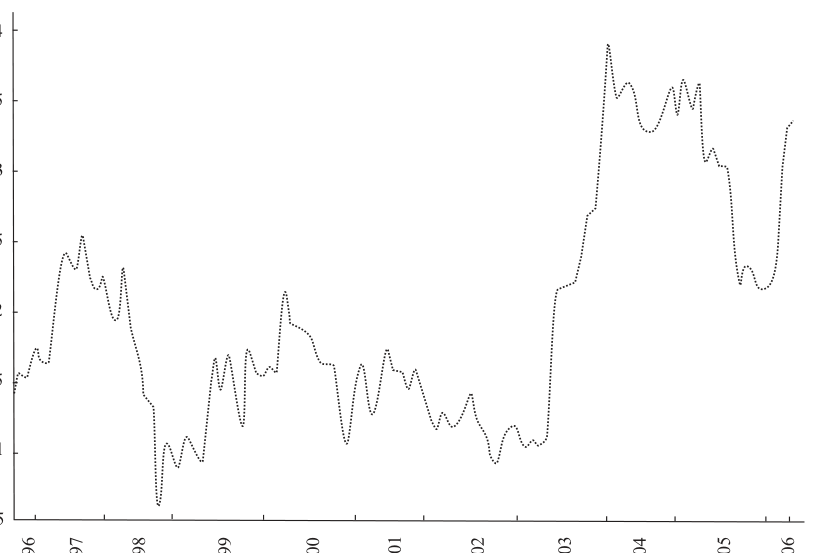
a) Cantv historical financial statements as at the annual close of 2005 (Appendix 1A) b) Projection of available cash flows, beginning with the year 2006 (Appendix 1B); and c) Evolution of share price, to date, in the Venezuelan securities market (Appendix 1C).
3. VENEZUELA: A SPECIAL CASE?
In 2006 the panorama in Venezuela seemed uncertain: the perspective of an electoral year, the favorable scenario of high oil prices, and the warnings of many analysts with respect to the excessive dependency of the economy on oil prices. In the elections scheduled to take place that year, President Hugo Chavez was postulating for reelection and was odds-on favorite. Hugo Chavez was first elected in December 1998, on a political platform named “Polo Patriótico”, and a populist promise called “Revolución Bolivariana” in honor of Simon Bolívar, XIX century hero who achieved the independence of Venezuela and four other South American countries.
In 1998 Venezuela was a nation with a strong democratic tradition in Latin America, being the fourth biggest economy in the region, after Brazil, Mexico, and Argentina. A democratic system was established at the end of the fifties, which gradually passed to form a twoparty system. During the first twenty years of this system (1958-1978) Venezuela achieved the highest economic growth per inhabitant at world level, and the alternation of power between the two main political parties occurred normally. To the contrary, the second period (1978-1998) registered one of the worst economic performances in the world, which resulted in a marked deterioration of the social situation. The end of this second period and of the two-party and bicameral political system that had prevailed for forty years, coincided with Hugo Chavez’ being elected in December 1988. A year after, December 15, 1999, a new Constitution was
approved, concentrating more power in the central government and in the State in general. The balance of power between the National Executive and Parliament was being surrendered each time more to the figure of the President.
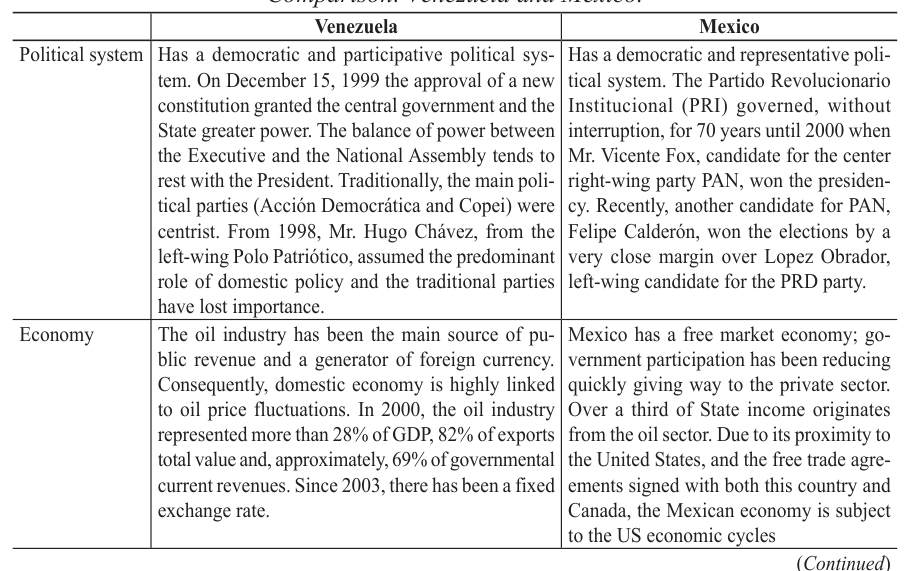
In 2006, after surviving many elections and eight years in power, the Chavez administration maintained its populist public policies, increased public expenses with low efficiency, and high oil prices. Oil represented 82% of Venezuelan exports, a source of 69% of the government current income, and constituted 18% of the GDP. During 2005 and 2006, oil prices had reached their all-time high in the last 25 years (in real terms), which contributed to a high level in Venezuela’s international reserves, above US$ 30 billion, combined with a low external debt in comparison to other Latin American economies.
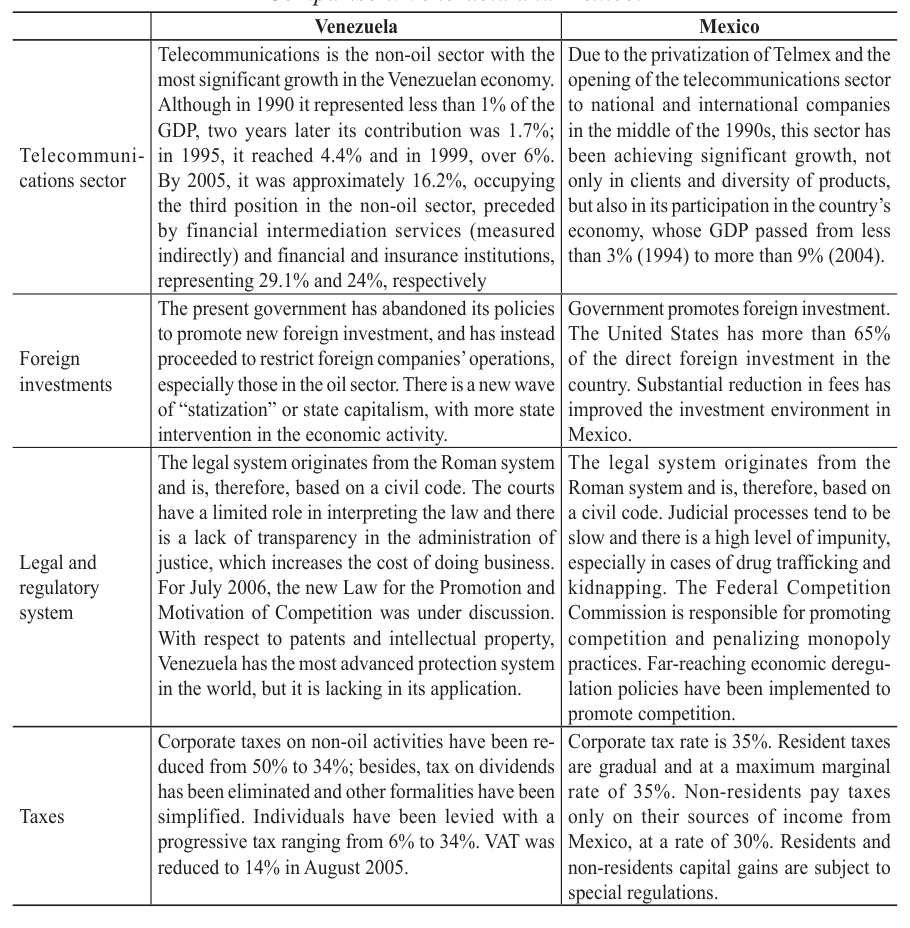
Regarding volume of activity, the telecommunications sector experienced the highest growth in the Venezuelan economy at this time. By 1990 it represented 1% of GDP, but in 1999 it was over 6%, and in 2005 near 16%. The Telecom sector was classified as the third most important non-oil sector in Venezuela, after financial intermediation services (measured indirectly) and financial and insurance institutions that accounted for 29% and 24%, respectively.
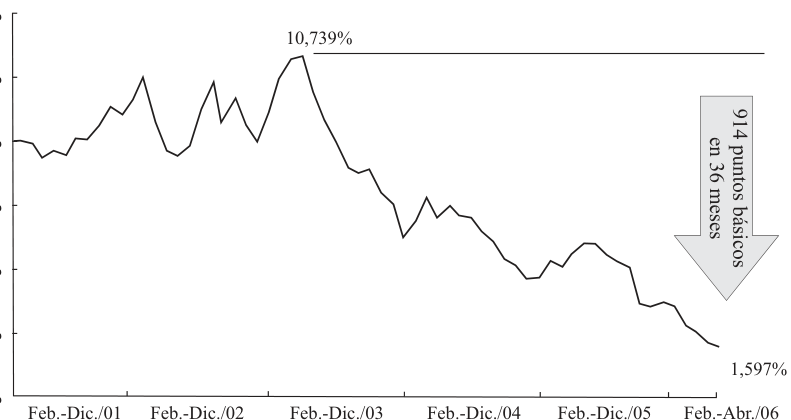
Despite the oil bonanza, risk-rating agencies classified the Venezuelan sovereign debt as junk bond, among the worst in the region. However, the spread between the Venezuelan debt bonds and the equivalent US Treasury bonds was only 1.60%, after falling during the previous three years as oil prices increased and Hugo Chavez consolidated his political power. Appendix 2 shows the spread evolution of the Venezuelan sovereign bonds since 1991. Interestingly, a junk-bond rating had coexisted for over two years with a very low spread for the Venezuelan sovereign bonds. Sovereign and corporate bonds with ratings similar to Venezuela, presented an average spread of 5.50%. It seemed as if risk-rating agencies and financial markets were operating at different frequencies.
Telmex did not find this same situation in Mexico or other countries where the group had recently made acquisitions, such as Brazil, Chile and Peru. Appendix 3 shows a summary comparing the Venezuelan situation, where Telmex would possibly invest, with Mexico. Additionally, Appendix 4 shows details of Telmex’s acquisitions in Latin America.
4. WHICH IS THE ADEQUATE DISCOUNT RATE FOR CANTV?
During his career, Alfredo had interacted with world leading investment banks that advised Telmex in various acquisitions in Latin America. The valuation methodology in all those cases was based on estimating cash flows free of debt, discounting them using a weighted average cost of capital (WACC), and taking out net present value of debt. In the case of Cantv, none of the components of the formula represented an issue to Alfredo, except for one: the cost of capital. Moreover, Cantv had closed 1995 almost free of financial debt. Its debt-to-assets ratio was 1.43%. Due to this particularity, the cost of capital, the required return for an equity investment in Cantv, was almost identical to its WACC.
For estimating the cost of capital, the method most widely used, that not only Alfredo but also the Board of Directors of Telmex was more familiar with, was based on estimating
the required rate of return for a similar investment in the US using the Capital Asset Pricing Model (CAPM), and adding up a country-risk premium.
R = R + * R R i f i m f b – ( ) + spread where:
1) R i is the rate of return adjusted in US dollars for the emerging country; 2) R f is the risk free rate in the United States, represented in US treasury bonds with a term similar to the investment; 3) b i is the beta of comparable companies that are in the same business and have a mixture of similar products; 4) (R m – R f ) is the historical risk premium of the New York market (historically, between 7% and 8%); and 5) Spread (for country risk) is the differential in returns of sovereign debt bonds of the emerging country in question with respect to comparable long-term bonds of the US Treasury (Appendix 2 shows the evolution of this differential for Venezuela).
This procedure is similar to what Alfredo and his work team used when calculating the discount rate for investments in Mexico, or in emerging countries where they had participated. Formerly, this method had produced values acceptable to the Telmex management; with returns (in dollars) between 14% and 16% for investments in telecommunications in Mexico.
Based on all this experience, Alfredo proceeded to calculate the rate of a telecommunications project in Venezuela.
1) Risk-free performance of US treasury bonds (Bloomberg, T-5 3/8 02/2031) = 5.34% 2) Telecommunications sector beta (USA) = 1.20 3) Market premium (NYSE, Ibbotsson Associates) = 7.50% 4) Venezuelan sovereign debt spread (Appendix 2) = 1.60% R i = 5.34% + 1.20*(7.50%) + 1.60% R i = 15.94% The Telmex-America Movil Board of Directors unanimously rejected this figure, no one was willing to run the risk of a capital investment in telecommunications in Venezuela in exchange for a 15.94% return. The majority of the members, all with wide financial experience in the region, alleged that the risk of investing in such a volatile economy were more in agreement with a “minimum” discount rate of 22%-24%. In the same meeting, one of the external directors suggested the possibility of “adjusting” Alfredo’s calculations, based on the difference in the volatility of the Venezuelan capital market with respect to the US market. This “adjustment” would increase the rate to more “reasonable” values.
5. AFTER THE BOARD MEETING: GET ON WITH THE WORK!
Alfredo Ramos was frankly disappointed after the meeting. The Board did not use any special formula to determine the rate of 22%-24%, which they demanded as a “minimum” for such an investment in Venezuela. It was simply a matter of experience and risk perception. He needed something more concrete to present his project and begin negotiations with Verizon. He knew that he could not go to the negotiation table with an evaluation of cash flow discounted with a rate that was pulled out like “a rabbit out of his hat”. He must have a well reasoned support or, to the contrary, it would be difficult to negotiate. He was aware of other methodologies – alternative to CAPM – for estimating the cost of capital, but they were not widely used either by the market or by the Telmex-America Board. The sole idea of presenting a valuation using a different methodology was likely to inspire suspicion and engineer endless and increasingly theoretical discussions. Even though Alfredo knew about the limitations of CAPM to estimate the cost of capital, its popularity and use outweighed the criticisms.
His position was not an easy one. As the buyer, Telmex was interested in a higher discount rate. The seller, Verizon, was surely going to defend rate calculations based on the procedure traditionally used by investment banks. He needed to justify very well the rate he would use based on the reference range of 22%-24% that the Board requested.
In addition to justifying the desired rate, Alfredo Ramos had developed a keen intellect that made him pose the problem in the following terms: What is happening in Venezuela? What is different there? Why the formula widely used by investment banks is yielding results that are entirely rejected by the Board, while in other latitudes it did not give rise to such controversies? Why did it work then and not now? What had changed? How can such a high rate be justified when the sovereign debt spread is so low?
Based on the arguments used by the different members of the Board over the long discussion, Alfredo realized that he may need to incorporate into the analytical framework some additional factors. Besides taking into account sovereign risk, he would need to look at US and Venezuela market volatilities, differences in sensitivity of the telecommunications sector to overall market movements; degree of correlation between both countries; degree of correlation between domestic equity market and sovereign debt.
He decided to get his investment management team together in the Telmex complex in Mexico City, and asked them to gather information related to all these aspects for Venezuela. A week later he received a report with the following data:
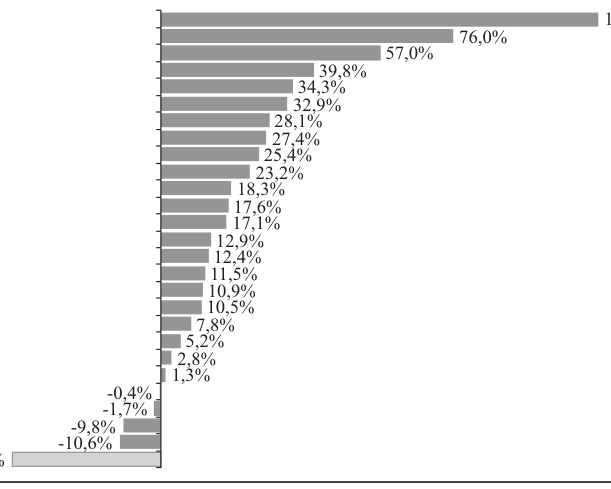
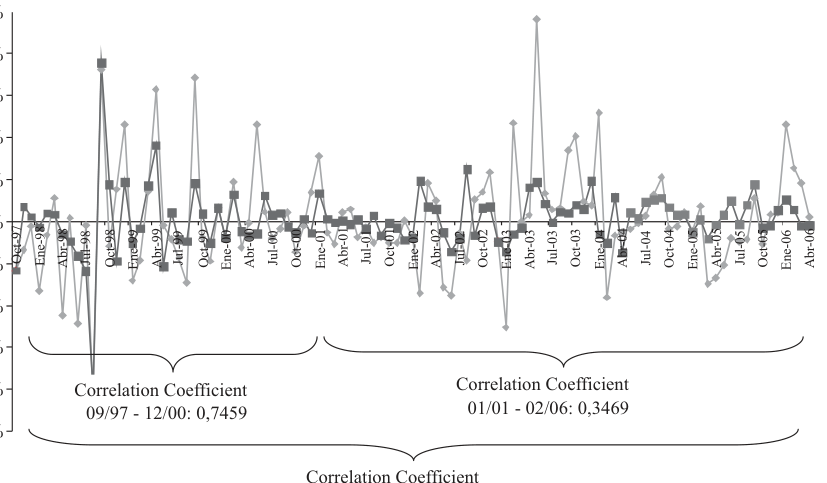
1) The Venezuelan sovereign debt spread with respect to the United States had fallen 914 basis points in the last 36 months, and —at the date of the report— it registered a historic low of 1.597% (Appendix 2). 2) The Mexican debt spread was similar to Venezuela’s (1.562%). 3) In 2005, the Caracas Stock Exchange (BVC) registered the worst performance of the emerging markets, with a fall in US dollars of 38.6% (Appendix 5). 4) The correlation between the Venezuelan sovereign debt bonds and the Caracas Stock Exchange BVC Index was 59.37% over the last 10 years (Appendix 6).
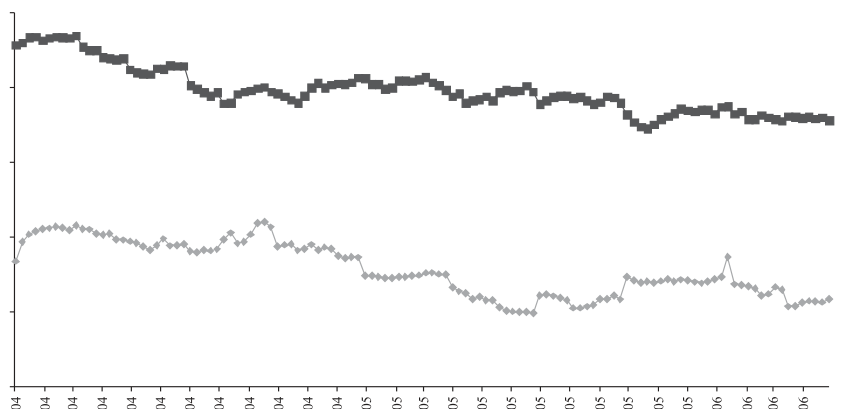
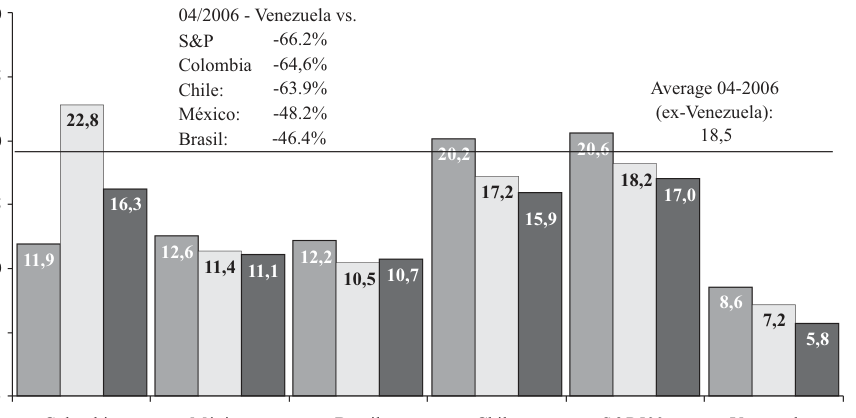
5) Nevertheless, there were two periods clearly differentiated: from 1997 to 2000 the correlation between the Venezuelan sovereign debt and the Caracas Stock Exchange was 74.59%, while in the period 2001-February 2006, it was only 34.69% (Appendix 6). 6) At the close of 2005, the average price-earning (P/E) ratio of the BVC (7.22) was still 60.39%, below what the S&P500 index (18.23) registered (Appendix 7). 7) The Caracas Stock Exchange P/E ratio showed high discounts on being compared not only to the United States (S&P500), but also with the other stock exchanges in Latin America (Appendix 8). 8) The correlation between the S&P500 and the BVC indices remained stable throughout the last 10 years (31%) (Appendix 9). 9) Volatility (σ) of the Venezuelan market was 11.73%, compared to 4.25% in the US. 10) CANTV displays a sensitivity (beta) to the Venezuelan domestic market estimated at 0.93 11) The BVC volatility in the last 10 years had been almost three times higher than that of the S&P500 index (σ VEN /σ USA = 2.76) (Appendix 9). 12) In Mexico, as well as in other places where Telmex had recently invested, a high correlation between the movements of the local securities market and sovereign external debt bonds is observed: between 67.6% (Mexico) and 79.6% (Brazil); these values strongly contrast with the 35.7% that Venezuela had since 2001 (Appendix 10 shows the correlation in Brazil; Appendix 11 in Mexico; Appendix 6 in Venezuela).
Alfredo was intrigued with various aspects of the information collected. There was a contrast as to how the Venezuelan sovereign debt had such a low correlation (34.7%) with respect to the stock market (BVC) between 2001 and 2006, especially when compared to the correlation prior to 2001 in Venezuela, or with the correlation for the last 10 years in the Mexican or Brazilian markets. Was it that as from 2001 the most used formula to estimate discount rates in emerging markets —formula that add the sovereign debt spread to comparable performance in the USA— was no longer applicable in Venezuela? Had it lost effect since the risk to invest in the Venezuelan private sector had been separated from sovereign risk? Discounts in the P/E ratio at which assets in the country were negotiated indicated much higher levels of private risk than sovereign risk.
Another aspect that attracted his attention was that even when the spreads of the Mexican and Venezuelan sovereign debts were similar, the return rates that the Board of Directors wanted for the latter were much higher that what they requested from the former. What seemed clear to Alfredo was that he should incorporate, somehow, the volatility of the Venezuelan securities market to the discount rate estimate. This view also had its inconveniences. The Caracas Stock Exchange listed very few companies; therefore, it could not be considered representative of the spectrum of the private sector economic activity in Venezuela. Its diminutive size and corresponding few transactions contributed to the higher volatility that, in comparative terms, the market presented.
Alfredo Ramos had full confidence in his team’s work on evaluating the projection of the Cantv cash flow. He also felt respect for the experience and “guts” of the members of the Board
with respect to determining the “minimum” required rate of return for Venezuelan investments. But the resulting values for discounting those flows (current net value), as per the formula used, presented a wide range of variation. He only had 10 days to present to the Board a return on equity estimation that suited their risk perception while at the same time using the estimation methods they were more acquainted with. That estimation would have to be strongly supported by market facts for Alfredo to be able to defend it in the negotiation with Verizon.
Carlos Alberto Molina es profesor titular del IESA (Venezuela) y coordinador del Centro de Finanzas del IESA. También es Ph. D. en Finanzas de la Universidad de Texas en Austin (2002), MBA del IESA (1994), e ingeniero civil de la Universidad Católica Andrés Bello (1990, Venezuela). Sus intereses de investigación están relacionados con las áreas de finanzas corporativas, la estructura de capital y el gobierno corporativo. Ha hecho diversas publicaciones sobre estos temas, incluyendo artículos en el Journal of Finance y el Financial Management .
Miguel Ángel Santos es profesor adjunto del Centro de Finanzas del IESA (Venezuela). Es Chartered financial analyst (2004), M. Sc. en Economía de Queen Mary College, Universidad de Londres (1996), MBA del IESA (1995), y licenciado en Ciencias Administrativas y Gerenciales de la Universidad Tecnológica del Centro (1993, Venezuela). Posee más de doce años de experiencia en desarrollo de negocios y banca de inversión en América Latina. Sus intereses de investigación están relacionados con la influencia del entorno macroeconómico y la política económica en las prácticas de finanzas corporativas, la política de dividendos, y fusiones y adquisiciones. Es columnista semanal del diario El Universal .
Recepción del artículo: 06/04/2009 Envío evaluación a autores: 05/07/2009 Recepción correcciones: 07/08/2009 Aceptación artículo: 04/09/2009
Appendix 1 A) Cantv – Consolidated Financial Statements, in thousands of dollars, as of end of each year.
Appendix 1 A) Cantv – Consolidated Financial Statements, in thousands of dollars, as of end of each year.
Source : Economatica database, www.economatica.com.
B) Cantv – Cash Flow Projection.

US$ 2004 US$ 2005 US$ 2006 US$ 2007 US$ 2008 US$ 2009 US$ 2010 Operating activities Net income 160 100 221 337 486 645 889 Adjustments to reconcile income to net cash :
Appendix 1 B) Cantv – Cash Flow Projection.
C) Price of Cantv share in US$ – Caracas Stock Exchange.
Source : Bloomberg, own calculations, www.bloomberg.com.
Appendix 2 Sovereign debt spread vs. US Treasury bonds.
Source : Bloomberg, own calculations, www.bloomberg.com .
Appendix 3 Comparison: Venezuela and México.
( Continued )
Appendix 3 Comparison: Venezuela and México.
Appendix 4 The Telmex-América Móvil Group acquisitions in Latin America.
Company Country Amount Date Comments In August 2005, América Móvil S.A. de C.V. bought 100% of the TIM Peru operations, a company controlled by Telecom Italia Mobile S.p.A. Since then, with the name América Móvil Peru, it operates under the trademark “Claro”, giving coverage to 24 departments of this Andean nation. When it was bought over, the company had a portfolio of more than 1.4 million clients and had attained a 31% participation in the Peruvian market.
TIM Peru Peru US$ 512 million August 2005 ( Continued )
Appendix 4 The Telmex-América Móvil Group acquisitions in Latin America.
Company Country Amount Date Comments In August 2005, América Móvil S.A. de C.V. acquired 100% of the Chilean Operating company Smartcom S.A. (“Smartcom”) from the Spanish company Endesa Participadas S.A.; Smartcom provides Chile with mobile and added value telephone services at national level. At the close of June 2006, the company had approximately 1.7 million cellular telephone subscribers.
Smartcom Chile US$ 472 million August 2005 Embratel Brazil US$ 628 million August 2004 In 2004, the Mexican group Telmex acquired 100% of Embratel, Brazil.
Sources : Available online: http://www.americamovil.com/ (Consulted: July 12, 2006). “The Telecom King of Latin America?”. Business Week Magazine , March 29, 2004. Available online: http://www.businessweek.com/ magazine/content/04_13/b3876093_mz057.htm . (Consulted: July 12, 2006).
Appendix 5 Performance of stock markets in emerging countries (Percentage in change between December 31, 2004 and December 31, 2005.
Source: Bloomberg, www.bloomberg.com.
Appendix 6 Monthly price variation: Global 2027 and Caracas Stock Exchange Index (IBVC), in percentage.
Source : Bloomberg, own calculations, www.bloomberg.com.
Appendix 7 P/E Ratio: Caracas Stock Exchange (BVC) and the S&P500 (2004–April 2006)
Source : Bloomberg, own calculations, www.bloomberg.com.
Appendix 8 P/E Ratio: Caracas Stock Exchange (BVC) and the S&P500.
Source : Bloomberg, own calculations, www.bloomberg.com.
Appendix 9 Monthly variation of returns: S&P500 and Caracas Stock Exchange (BVC)
in percentage.
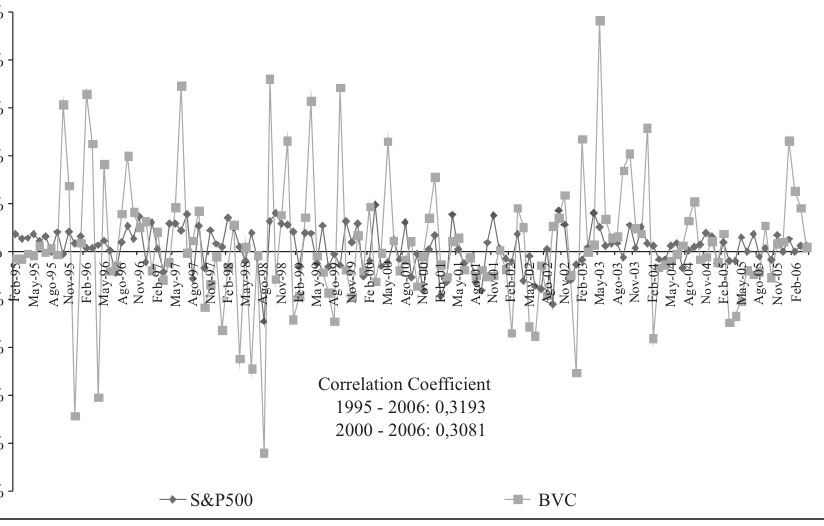
Source : Bloomberg, own calculations, www.bloomberg.com.
Appendix 10 Monthly variation of returns: Mexico 2026 and Mexbol (Mexico Stock Exchange)
in percentage (Sept. 1997–April 2006).
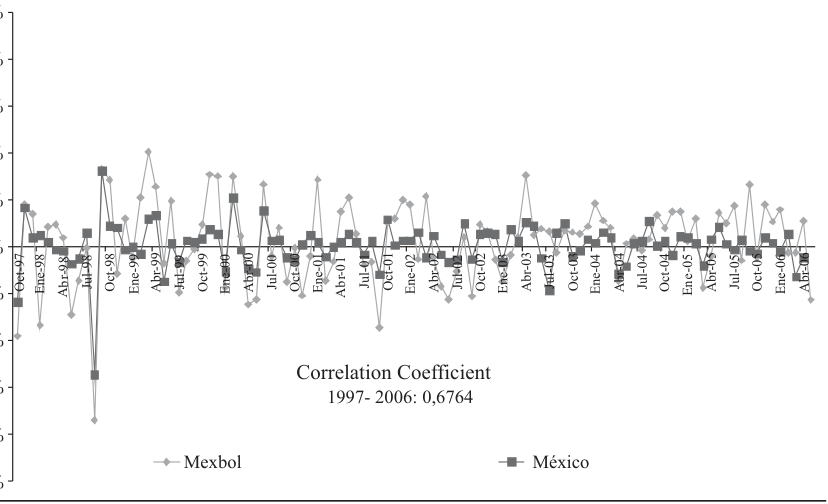
Source : Bloomberg, own calculations, www.bloomberg.com.
Appendix 11 Monthly variation of returns: Brazil 2023 and Bovespa (Sao Paolo Stock Exchange)
in percentage (Jan. 2000–April 2006)
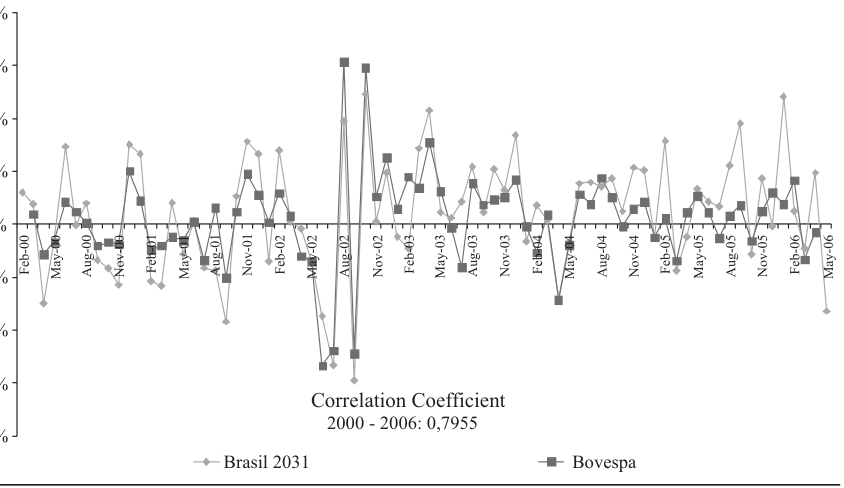
Source : Bloomberg, own calculations, www.bloomberg.com.