Transcripción completa del PDF reformateada para lectura web. Descargar PDF original para tablas, figuras y referencias.
Copyright 2022 Hausmann, Ricardo; Santos, Miguel; Barrios, Douglas; Taniparti, Nikita; Tudela Pye, Jorge; and Lu, Jessie; and the President and Fellows of Harvard College

After a large growth acceleration within the context of the commodity super cycle (2000- 2015), Namibia has been grappling with three interrelated challenges: economic growth, fiscal sustainability, and inclusion. Accelerating technological progress and enhancing Namibia’s knowhow agglomeration is crucial to the process of fostering new engines of growth that will deliver progress across the three targets. Using net exports data at the four-digit level, we estimate the economic complexity of Namibia – a measure of knowhow agglomeration – vis-à-vis its peers. Our results suggest that Namibia’s economy is relatively less complex and attractive opportunities to diversify tend to be more distant. Based on economic complexity metrics, we define a place-specific path for productive diversification, identifying industries with high potential and providing inputs – related to their feasibility and attractiveness in Namibia – for further prioritization. Namibia’s path to structural transformation will likely be steeper than for most peers, calling for a more active policy stance geared towards progressive accumulation of productive capacities, well-targeted “long jumps”, and strengthening state capacity to sort out market failures associated with the process of self-discovery.
Ricardo Hausmann, Miguel Angel Santos, Douglas Barrios, Nikita Taniparti, Jorge Tudela, and Jessie Lu
March 2022
Growth Lab
Center for International Development Harvard University
1. Introduction
Thirty years after independence, Namibia finds itself grappling with three interrelated challenges: reigniting economic growth, restoring fiscal sustainability, and promoting a more inclusive economy. After a prolonged growth acceleration driven by the investments and exports associated to the super cycle of commodity prices, the economy has stagnated, fiscal accounts deteriorated, and endemic inequality has become more prominent. Diversifying the Namibian economy will likely deliver progress along these three targets but has proven elusive to the resources and policy attention devoted by successive governments. We argue that productive diversification is constrained by the lack of productive knowhow out of the resource sector. Using net exports data from UMCOMTRADE we estimate the Economic Complexity – a measure of knowhow agglomeration – for Namibia and a group of African and international peers. Our results suggest that Namibia is relatively less complex and attractive opportunities to diversify tend to be more distant. We identify a set of products with high potential to be exported from Namibia, as they rely on existing productive capacities and knowhow. That approach differs from the aim towards beneficiation that has characterized Namibia’s industrial policy efforts and calls for a more active policy stance geared towards progressive accumulation of productive capacities, well-targeted “long jumps,” and strengthening state capacity to sort out market failures associated with the process of self-discovery.
Technological progress and knowhow agglomeration are fundamental to the process of structural transformation that characterizes economic development. Previous authors (Hidalgo, Klinger, Barabasi, and Hausmann, 2007) have documented that a consistent feature of development is that richer countries tend to produce a larger variety of goods, that on average very few countries are able to make. Alternatively, relatively poorer countries tend to produce fewer goods, that on average many places can make. This counters conventional wisdom, which states that societies should specialize in a narrow set of activities in which they have competitive advantages.
The progressive accumulation of productive capacities and knowhow, which allows places to produce a larger variety of goods competitively, does provide an account of structural transformation that is more consistent with the dynamics observed in the evolution of the productive structures of countries. The premise behind this theory, originally presented by Hausmann and Hidalgo (2009), is based on the idea that capabilities and knowhow are not observable but are signaled by the number and nature of the products and services that a place is able to produce and render competitively. Countries lacking many capacities will only be able to assemble a relatively modest number of products (little variety), which will also be feasible in many other places (higher ubiquity). Countries that accumulate many capacities will be able to produce a relatively large number of goods (large variety), which on average only a few places will be able to produce (lower ubiquity).
In this context, the process of diversification poses a chicken-and-egg dilemma: nobody wants to acquire skills for an industry that does not exist; if those skills remain absent, it is unlikely the industry will develop. Hidalgo and Hausmann (2009) have provided insights on how societies have come around this dilemma: Countries do not diversify randomly; they rather spread towards activities that demand productive capabilities that are similar to those they already possess. Current capacities and knowhow can be recombined and redeployed into new, “adjacent,” economic activities.
4 | Economic complexity report: A roadmap for productive diversification in Namibia
This paper is aimed at quantifying the depth of the knowhow agglomeration in Namibia – as signaled by the products the country is capable to manufacture and export competitively – and identifying opportunities for productive diversification based on their technological proximity to the existing set of capacities. We define proximity between a pair of products by estimating the conditional probabilities for a country to have a revealed comparative advantage in one product, given that it already exhibits revealed comparative advantage in another product. Following that process, our proximity matrix between pairs of products is estimated by their tendency to co-locate, the same criteria used by Hausmann et al (2014). The idea is that if two sectors require a similar set of capabilities, the fact that one of them already exists in a place suggests a high likelihood for competitiveness on the other.
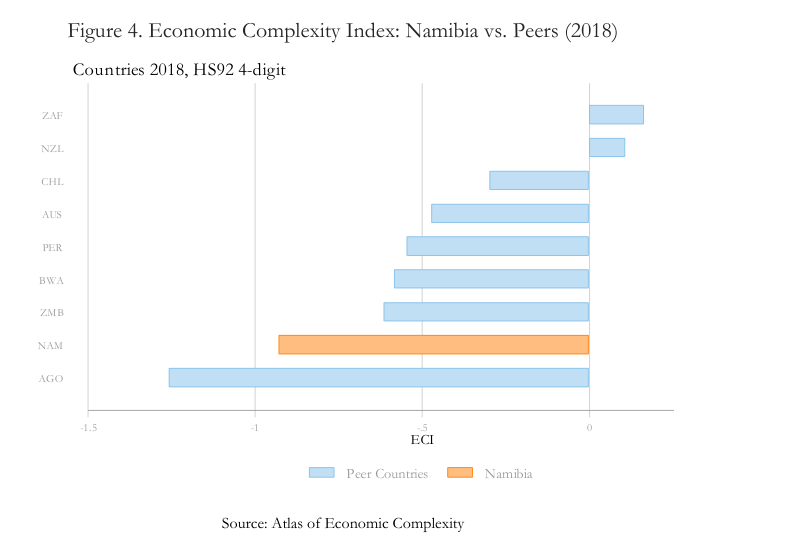
In the case of Namibia, we have defined revealed comparative advantage (RCA) by applying the definition of Balassa (1964) to net exports at the four-digit level. We relied on net exports to correct for potential re-exports that we have detected within the course of our research, based on differences between UNCOMTRADE and domestic databases. 1 Correcting for re-exports allows for a more precise characterization of Namibia’s productive capacities and identification of sectors that can be potentially developed by redeploying existing skills. This is also why our results differ from the visualizations of the Atlas of Economic Complexity for Namibia that are publicly available online. 2 Our results highlight three important and interrelated lessons. First, Namibia’s Economic Complexity Index (ECI) ranks amongst the lowest of regional and international peers for the previous two decades, only surpassing Angola. This is consistent with the relatively low diversity and high ubiquity of its existing exports. Second, Namibia has been able to diversify differentially more than the average country and most of its peers, given its current set of productive capabilities. Third, and related to the previous one, the problem is not so much that Namibia has not diversified into adjacent products, but rather that given the relatively low depth of its knowhow agglomeration these opportunities have limited strategic value. 3 The Complexity Outlook Index (COI), which captures the number of absent complex products that demand knowhow and productive capabilities that are similar to those already in place, shows that Namibia has few complex products within a relatively short Distance.
These three lessons suggest that the path to productive diversification and ultimately structural transformation in Namibia might be steeper than for most peers, calling for a more active policy stance geared towards progressive capability accumulation, well targeted “long jumps”, and strengthened state capacity to sort out market failures associated with the process of self-discovery.
Using economic complexity metrics we identify a place-specific path for productive diversification, highlighting industries with high potential and providing inputs – related to their feasibility and attractiveness in Namibia – for further prioritization. The different feasibility and attractiveness dimensions have been informed by policy priorities as highlighted in several interviews with government officials. These are meant to be illustrative prioritization criteria that helps in better targeting government efforts and may vary in response to changes in data availability, conditions on the ground, or in policy priorities. To facilitate policy efforts, we have organized the resulting set of 5 | Economic complexity report: A roadmap for productive diversification in Namibia
products with high potential to lead productive diversification in Namibia into five diversification themes: (i) Chemicals & Basic materials, (ii) Food industry, (iii) Machinery and electronics, (iv) Metals, mining & adjacent industries, and (v) Transportation and logistics. This exercise is meant to be serve as a roadmap to inform broader diversification process and should be refined and improved through iterations with relevant stakeholders and the authorities responsible for leading the efforts on productive diversification.
Namibia’s previous industrial policy efforts have not followed an approach based on productive capabilities and knowhow but have rather focused on the idea of adding value to raw materials. As stated in the Growth at Home Strategy 2015-2020 of the Ministry of Industrialization and Trade (2015) , “value addition is perhaps the most important feature of Growth at Home. Namibia is well endowed with numerous raw materials, and this presents a tremendous opportunity for value addition”. We identify industries with strong forward linkages from Namibia’s raw materials and demonstrate that in terms of productive capacities the strategy is clearly suboptimal. The institutional effort needed to supply the missing skills required by industries downstream Namibia’s raw materials are larger than those required by other industries of similar Economic Complexity. Alternatively, with the same effort required to fill the capability gaps needed to materialize an industry that adds value to Namibia’s raw materials, the country could develop industries of higher Economic Complexity.
The report is organized in five sections. Section 2 outlines the conceptual framework of the report, including a description of the theory behind the Economic Complexity methodology and relevant considerations for its application in the Namibian context. Section 3 is devoted to analyzing the depth of existing knowhow agglomeration in Namibia vis a vis a group of regional and international peers. In section 4 we identify opportunities for productive diversification based on Economic Complexity metrics, and in section 5 we introduce additional filters based on feasibility and attractiveness considerations that may complement the Economic Complexity methodology. Section 6 concludes the report by summarizing our most significant insights and their policy implications, as well as exploring potential avenues for future research.
6 | Economic complexity report: A roadmap for productive diversification in Namibia
2. Conceptual framework
2.1 Theory of Economic Complexity
The theory of economic complexity, introduced by Hausmann, Hidalgo et al. (2011), is based on the realization that the development of products and services not only requires raw materials, labor, and machinery, but also tacit knowledge (or “knowhow”) of how to put inputs together to produce things and run business operations. This tacit knowledge tends to be the limiting factor for diversifying economic activities because it is the component most difficult to procure. Knowhow can only be acquired through experience and tends to be spread across many individuals who need to coordinate across teams and organizations.
Some products and services incorporate large amounts of knowhow and types of knowhow that are valuable for multiple uses. In contrast, other products and services incorporate much less knowhow or knowhow that is not transferable for other valuable uses. As an analogy, different products and services can be understood as “words” whose production requires “letters” (knowhow-based capabilities), like in a game of Scrabble . The production of long and sophisticated words requires many letters, including some high-value letters, while few are needed to generate short and simple words. The knowhow embedded in places varies in terms of type and quantity. That is, some places have many diverse letters, which they can use in many combinations to make many different and valuable words, while others have few letters and letters with limited uses, which limits the possibility of creating new words. The differences in productive capacities brought by uneven “endowments” of letters are further amplified by the fact that the number of words that can be constructed increases exponentially as new letters are added. 4 Ultimately, places develop the products and services (words) that their knowhow-based capabilities (letters) can support. Tools of economic complexity aim to measure and utilize the patterns that result. By observing patterns of production across places and time, we can infer and mathematically construct quantitative measures that capture the diversity of knowhow embedded in a place (Economic Complexity Index, ECI) and how much knowhow specific goods and services require (Product Complexity Index, PCI). Places with a high ECI are able to support a diverse set of economic activities, including activities that are not common across places, while places with low ECI support a less diverse set of activities, and those activities tend to be ubiquitous across places.
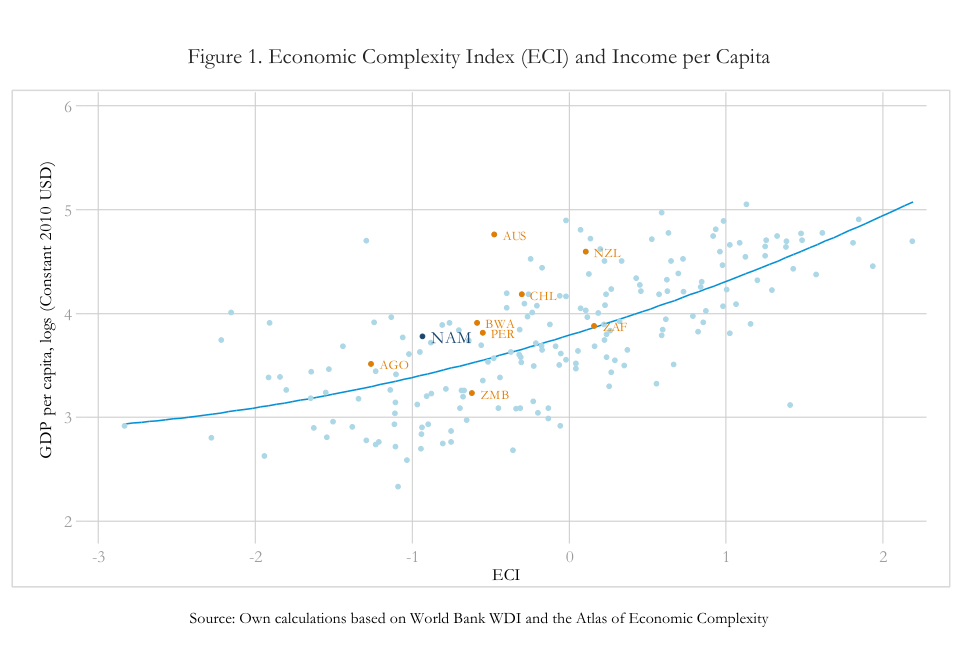
Given that economic complexity reflects the amount of knowhow that is embedded in the productive structure of an economy, it is not surprising to find a strong correlation between measures of complexity and income. Figure 1 shows the relationship between per capita income and economic complexity across all countries of the world.
Hausmann, Hidalgo et al. (2014) also found that the prediction errors in Figure 1– i.e., the difference between a country’s actual income levels and those predicted by its complexity – tend to be predictive of future growth dynamics. Countries with an economic complexity greater than expected given their 7 | Economic complexity report: A roadmap for productive diversification in Namibia
level of income tend to grow faster than countries that display a level of income that is higher than expected for their current level of economic complexity. In other words, countries positioned below the regression line are often poised to enter long periods of sustained growth, because removing key constraints (such as infrastructure, access to financial capital, or institutional gaps) will enable them to capitalize their existing stock of knowhow into higher output. Meanwhile, places above the regression line may be in a more precarious position (in terms of long-term growth) as they may be benefitting from a temporary positive shock. If this boom is not leveraged to increase the complexity of the economy to a level consistent with the current level of income, they run the risk of having their income fall toward the regression line once the boom comes to an end.
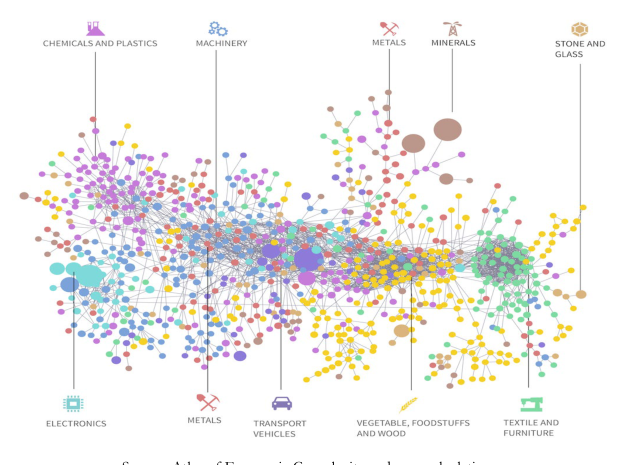
A final critical theoretical foundation of economic complexity was introduced by Hausmann and Klinger (2006). They showed that the probability that a place develops a new product is contingent on the set of products that it already produces. This allowed for the measurement of the similarity between products based on their shared capabilities. Based on this pattern, they proposed a measure of similarity or proximity between products. In essence, they measure the “proximity” between any pair of products based on the probability that countries are intensively engaged in both. The collection of all the resulting proximities can be visualized as a network connecting pairs of products based on their tendency to be co-exported by countries. They refer to this network as the Product Space and use it to study the productive structure of countries.
8 | Economic complexity report: A roadmap for productive diversification in Namibia
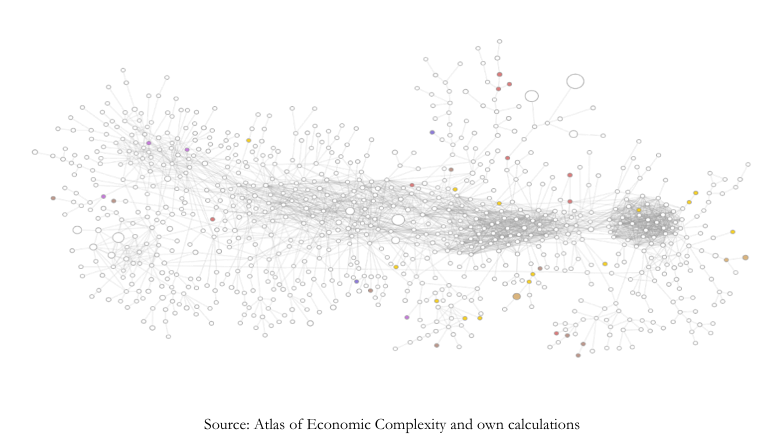
The structure of the product space is crucial because it determines the ability of countries to move into new products. A highly connected position in the Product Space reflects relatively easier paths to diversification than a sparse position. Hausmann and Klinger (2006) find that the product space is highly heterogeneous: some sections are composed of densely connected groups of products whereas others are more loosely connected. This heterogeneity has significant implications for the speed and patterns of structural transformation: the ability of countries to diversify and to move into products that are more complex is crucially dependent on their initial location in the product space. The complete product space and Namibia’s position in the space are shown in Figure 2 and Figure 3.
The location of a country’s production in the product space captures information regarding both the productive knowledge that it possesses and the capacity to expand that knowledge by moving into other nearby products. The strategic positioning of a place in the product space can be leveraged as an insightful tool for formulating economic diversification strategies.
Figure 2. Product Space Clusters
9 | Economic complexity report: A roadmap for productive diversification in Namibia
Figure 3. Namibia’s Position in the Product Space (2018, based on net exports)
2.2 Methodological adjustments on complexity metrics for the case of Namibia
The seminal contributions of economic complexity and most of the applied research that followed has been based on UNCOMTRADE export data at the country level. The reason being that it offers the most complete, granular, and lengthy internationally comparable database, and that algorithms to clean and process this information, and to calculate economic complexity metrics leveraging this data, have been adequately tried and tested. In the case of Namibia, however, even after applying algorithms specially designed to tease out errors in data gathering and reporting the information available in UNCOMTRADE was not consistent with local databases. Namely, there are UNCOMTRADE reported exports associated to industries that are not prevalent or existing in Namibia. These may occur for various reasons. First, because UNCOMTRADE may include re-exports, or exports originated in neighboring countries that leverage Namibia’s logistical infrastructure and are accounted as Namibia’s exports. Second, because Namibia may import machinery to be deployed in activities of exploration of exploitation of its mineral wealth, which may potentially be re-exported as secondhand after being used.
If we do not adjust for this possibility, we could be overestimating the real latent productive capabilities of Namibia and distort the identification of sectors with potential to be developed by redeploying existing skills. Products with little real basis to be considered as a diversification opportunity may be prioritized, and legitimate diversification opportunities may end up being discarded. To address that, we used net exports at an industrial aggregation of 4-digits 5 (rather than the more granular 6-digits) for all relevant economic complexity metrics. This approximation should correct for most misclassified exports and does a better job at identifying latent productive capabilities.
10 | Economic complexity report: A roadmap for productive diversification in Namibia
Box 1: Relevant concepts in Economic Complexity A description of several of the main variables in economic complexity methodology follows. It is important to bear in mind that apart from Revealed Comparative Advantage (RCA) and Diversity, all these measures are normalized indices that carry ordinal but not necessarily cardinal meaning. That is, the order of values may matter, but it may be meaningless to interpret the precise numerical value of an index.
∗ Revealed Comparative Advantage (RCA) : A place-specific measure that captures the relative prevalence of a product in a place. Following the methodology of Balassa (1964), it is usually calculated as the ratio between the proportion of the product in the export basket of a place and the proportion of the product in world trade. If this relationship is greater than one, the place has a “revealed comparative advantage” in that product, which is equivalent to saying that the place produces the good with higher relative intensity than the rest of the world.
∗ Product Complexity Index (PCI) : A product-specific measure that ranks the Diversity and Ubiquity of the productive knowledge required for its production. It is determined by an iteration between the average Diversity of countries that make the product, and the average Ubiquity of the other products that these countries make.
∗ Economic Complexity Index (ECI) : A place-specific measure that captures how complex a place’s export basket is. It is calculated as the average PCI of those products in which the place shows an RCA equal or greater than one.
∗ Distance : A place-product measure that corresponds to the sum of the proximities connecting a new good to all the products that country is not currently exporting. This value is normalized by dividing it by the sum of proximities between the new product and all other products. In turn, proximity is a product-to-product measure that is calculated as the minimum conditional probability that a country intensively exports one product given that it already intensively exports the other.
∗ Complexity Outlook Gain (COG) : A place-product measure that quantifies the extent to which adding a new product to the current export basket can open links to more, and more complex, new products. A high COG implies that a product is in the vicinity of more new products and/or of new products that are more complex, while a low COG means that a product is near many existing products and/or new products that are less complex.
∗ Complexity Outlook Index (COI) : A place-specific measure that evaluates the overall position of a place in the Product Space by calculating how far it is to alternative products and how complex these products are. A high COI implies that the place has an easier path towards greater levels of complexity, while a low COI means that achieving them will be more difficult as it implies moving into products that are further away.
11 | Economic complexity report: A roadmap for productive diversification in Namibia
3. The Economic Complexity of Namibia
Deploying the framework outlined above based net-exports data from UNCOMTRADE at the fourdigit level, we constructed economic complexity metrics for Namibia to infer collective knowhow. The results indicate that Namibia has a very low agglomeration of knowhow and low connectedness. The export acceleration – driven by higher prices and market shares – recorded over the large 2000- 2015 expansion was restricted to a few natural resources with very low shares of employment. That feature characterizes the growth patterns observed and is at the core of the challenges the country has faced to promote inclusive growth and increase the living standards of Namibians.
Namibia’s ECI is amongst the lowest of its regional and international peers (Figure 4), with an export basket composed mostly of primary products (Figure 5). Low ECI has been a constant for the previous two decades, surpassing only Angola among the group of regional and international peers. That feature is consistent with the low diversity and high ubiquity of its existing export products.
12 | Economic complexity report: A roadmap for productive diversification in Namibia
Figure 5. Namibia’s Net Export Basket (2018)
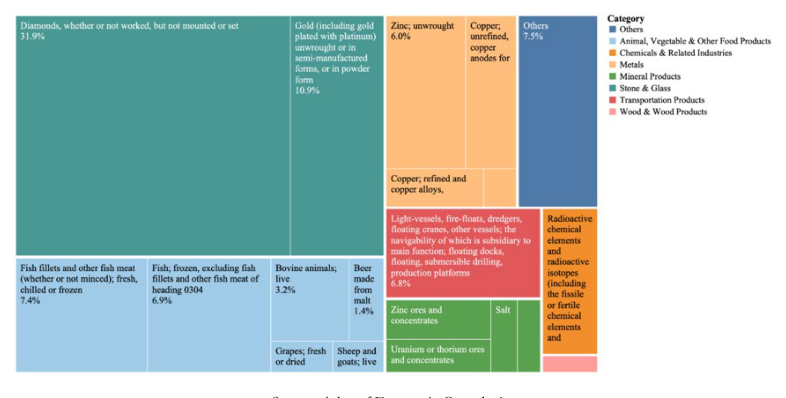
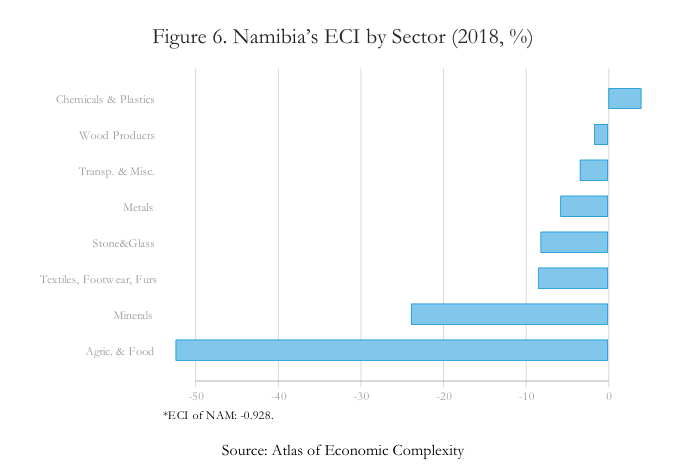
Namibia’s low ECI is explained in part because no product in its current export basket displays an average PCI above the global median, and the products that concentrate most of the country’s diversity – agriculture and mineral products – tend to be of low complexity. Only one sector – chemicals and plastics – has an average weighted PCI higher than zero, which contributes positively to Namibia’s economic complexity (Figure 6).
13 | Economic complexity report: A roadmap for productive diversification in Namibia
To assess the capacity of the Namibian economy to diversify into nearby products – from a technological proximity standpoint – we estimated the probability of developing one product with RCA greater or equal than one for the period 2010-2018. We performed that calculation for Namibia and its peers, controlling for their position in the product space, following specification:
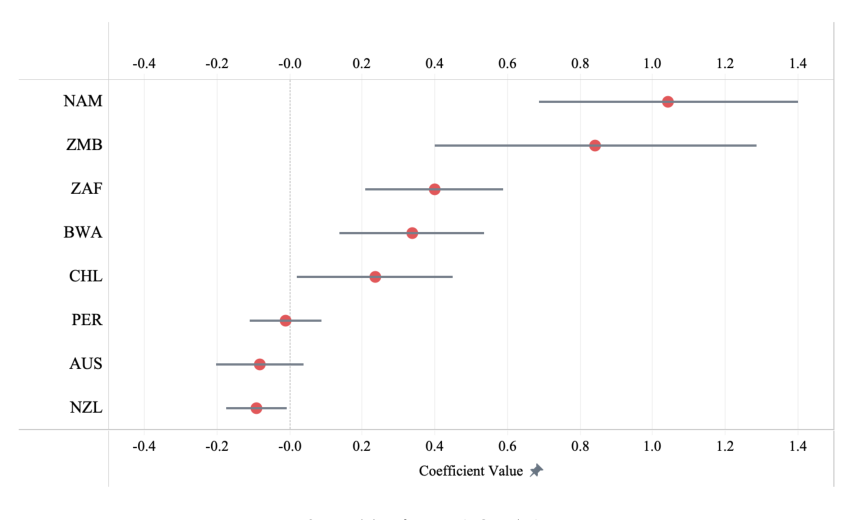
jjuuuuuu iiii = ff(dddddddddddddd iiii , rrrrrr iiii , cccccccccccccc ii , cccccccccccccc ii _dddddddddddddd iiii ) , where jump is a dichotomic variable that takes the value of 1 if in a period of 8 years the RCA of industry j in country i went from 0.25 or lower to 1 or greater than 1. The parameter of interest is , cccccccccccccc ii _dddddddddddddd iiii , which captures the relationship between the density of the country’s product to its diversification process over time vis a vis the average country. Thus, a statistically significant and positive coefficient indicates that the country has been able to jump differentially more than the average country.
Our results suggest that over the previous decades Namibia has been able to diversify into products which are adjacent to its exiting capabilities. As a matter of fact, the country has been able to diversify differentially more than the average country and more that most of its peers, given its current set of productive capabilities (Figure 7). Put in a different way, within the context of low ECI, the country has been able to materialize diversification opportunities by conquering adjacent products.
Figure 7. Differential Effect of Density over the Probability of Jumping by Location (2010-2018)
The problem is not so much the capacity of Namibia to diversify into adjacent products, but rather that – given its positioning in the product space – the country has very limited diversification opportunities, and these opportunities tend to be of limited strategic value. Most Namibian export 14 | Economic complexity report: A roadmap for productive diversification in Namibia
products lie at the periphery of the product space and distant from each other, which leaves very few potential nearby jumps (as depicted in Figure 3). Out of the products added since 2003, 95% of their value added corresponds to products with an average PCI lower than the global mean, essentially transport, metals, and stones. 6 This trend has been reinforced from 2013 onwards, by a relative increase in the number of products that many other places are also likely to make (high ubiquity).
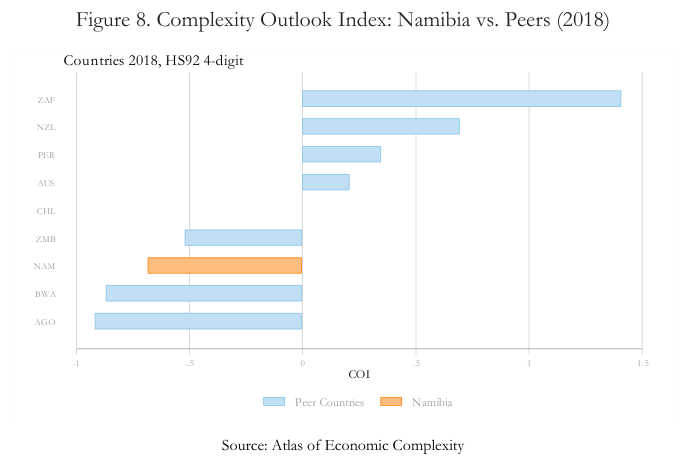
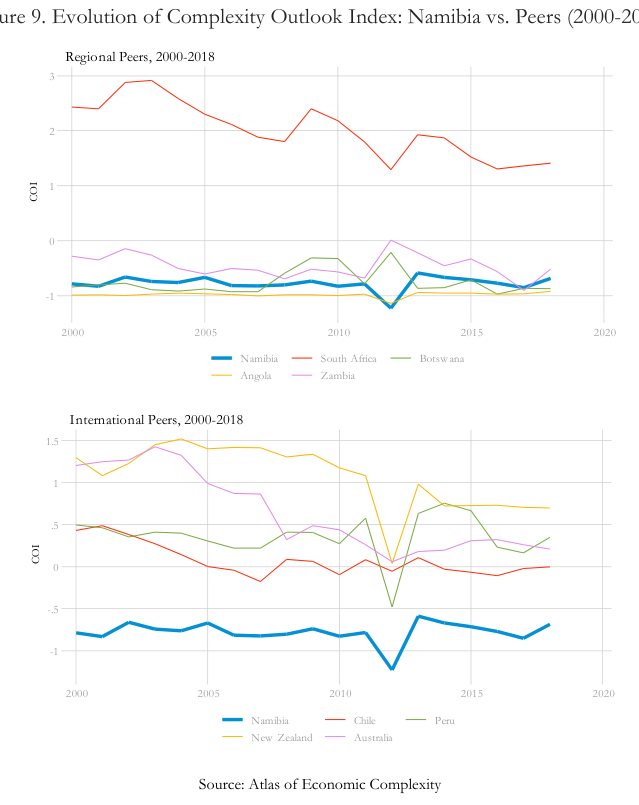
The country’s Complexity Outlook Index (COI), which captures the number of absent complex products that demand knowhow and productive capabilities that are similar to those in place, shows that Namibia has few complex products within a short distance (Figure 8 and Figure 9). That feature is mirrored at a more granular level by the average density by export category, which is lower for Namibia – for all export categories – than for the average of its regional and international peers. All of these indicators suggest that productive diversification in Namibia might follow a steeper – longer, riskier – process than in peers, calling for a policy strategy geared towards progressive accumulation of capabilities, targeted long jumps, and stregthening the state capacity needed to sort out market failures associated with the process of self-discovery.
15 | Economic complexity report: A roadmap for productive diversification in Namibia
Figure 9. Evolution of Complexity Outlook Index: Namibia vs. Peers (2000-2018)
4. Identification of diversification opportunities
4.1 Scope of the exercise
The objective of this exercise is to leverage the information associated with Namibia’s latent productive capabilities to develop a list of potential diversification opportunities. This exercise should not be interpreted as a final product, but rather as an initial contribution for an iterative process – involving a variety of stakeholders (policy makers, academia, industry experts, civil society, etc.) – to prioritize efforts around productive diversification and investment promotion. Furthermore, this effort is largely anchored around economic complexity, which is one of several possible approaches to approximate diversification paths. The fact that some industries or sectors are not accounted for in this approach does not imply they must be excluded from a broader national diversification strategy, as there may other valid evidence to substantiate their feasibility or attractiveness.
16 | Economic complexity report: A roadmap for productive diversification in Namibia
4.2 Process of sector identification
As was highlighted in Section 3, an assessment of Namibia’s Economic Complexity suggests that the country might benefit from a more active policy stance geared towards progressive capability accumulation, well targeted “long jumps”, and strengthening state capacity to sort out market failures associated with the process of self-discovery. An initial step in this direction is the identification of industries that may partially leverage existing productive capabilities and enable transitions towards more sophisticated economic activities.
This process – based on the tenets of Economic Complexity methodology – is summarized in Figure 10 and further detailed below. Given the relatively small population of Namibia – and hence limited long-run scope of local demand – and its exposure to sector-specific exogenous shocks, it makes sense to focus diversification efforts on tradable industries with export growth potential. Furthermore, it is possible to consider export growth along two dimensions: the intensive margin, where existing products can be scaled up; and the extensive margin, where new or nascent products can be successfully developed. Industries to be identified on the intensive margin are taken from the pool of products where RCA is greater than one (products that have a relatively larger presence in Namibia than in the rest of the World), while products to be identified on the extensive margin are taken from the pool of products with an RCA less than one (industries that have a relatively larger presence in Namibia than in the rest of the World).
Figure 10. Process for Sector Identification
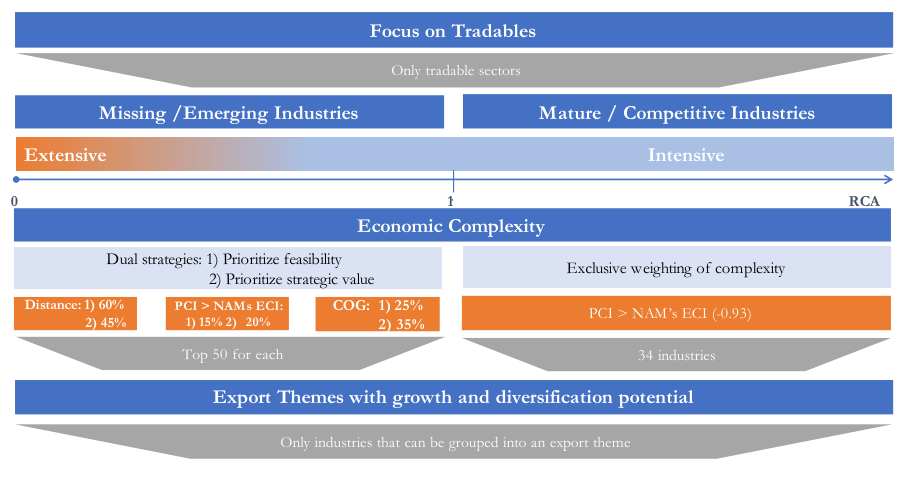
Diversification opportunities are then selected based on economic complexity metrics – Distance, Product Complexity Index (PCI), and Complexity Outlook Gain (COG) – in different ways for the intensive and extensive margins. Distance indicates how “nearby” a product is to products where 17 | Economic complexity report: A roadmap for productive diversification in Namibia
Namibia already exhibit RCA>1, and it serves as a proxy of the likelihood that the country further specializes in the prospective industry; PCI measures how complex a certain product is, and it serves as a proxy of whether the industry would help improve the country’s overall economic complexity; and COG quantifies how much developing a new product would enable access to additional new products of higher complexity, and serves as proxy of whether the industry would help improve the country’s overall strategic positioning.
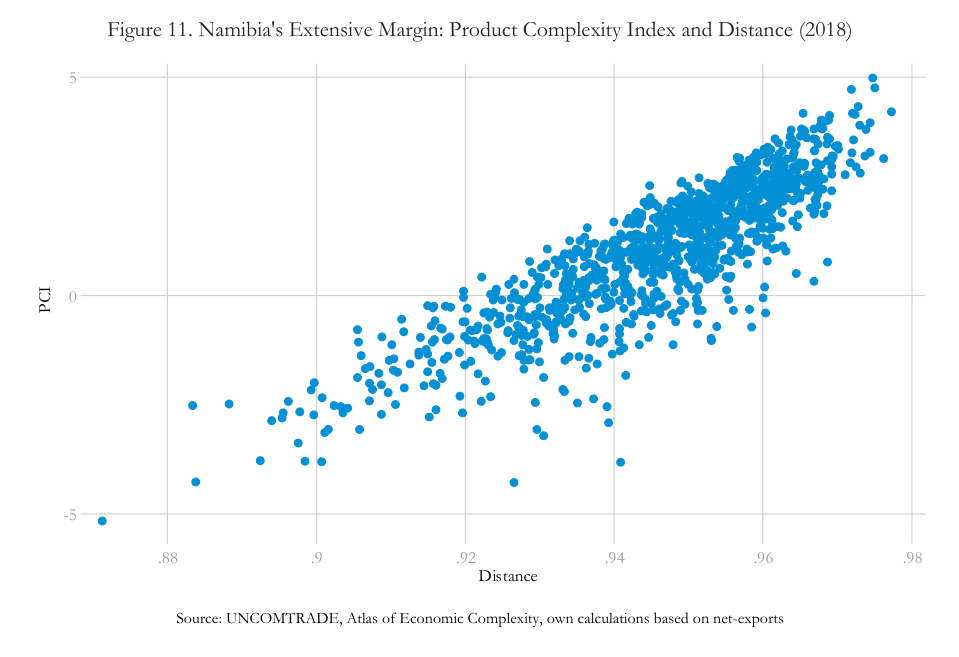
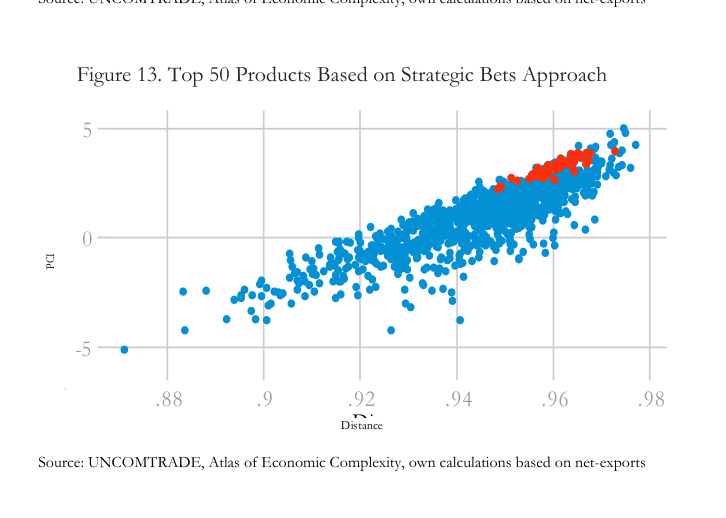
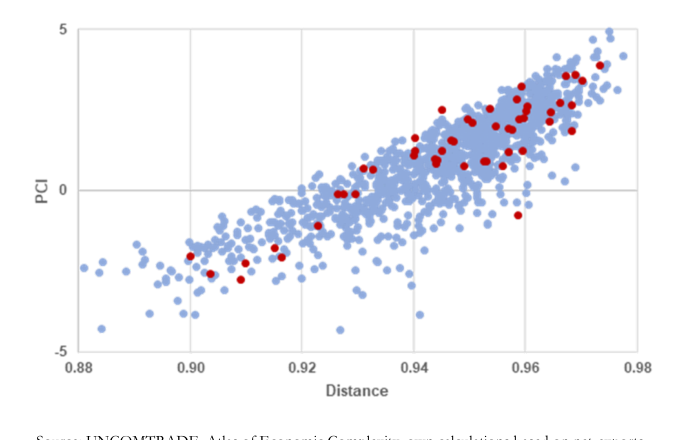
While PCI and COG may be positively correlated, in most countries 7 there tends to be a negative correlation between each of these variables and distance. This reflects an important trade-off: the most complex products and those with the best strategic positioning tend to be further away from existing capabilities, while less complex products tend to be closer. This negative relationship can be thought of as a risk-return curve. That is, the country may have less chance of success when trying to promote the development of more sophisticated products, because they require capabilities that are further away from its initial stock. However, if the place’s efforts are successful, rewards are greater as it will have gained greater complexity and improved its long-term strategic positioning. This trade-off can be visualized in which plots PCI and distance for all products in Namibia’s extensive margin.
18 | Economic complexity report: A roadmap for productive diversification in Namibia
The process for identifying diversification opportunities aims to balance these three dimensions. On the extensive margin, two approaches are put forth. One – parsimonious industrial policy – prioritizes likelihood of success (distance) and the other – strategic bets – prioritizes strategic value (PCI & COG). Both approximations give positive weights to all three complexity variables. 8 For the Parsimonious Industrial Policy (PIP) approximation, a weight of 60% is applied on distance, while the remaining 40% is applied on PCI (15%) and COG (25%). For the Strategic Bets (SB) approximation, a weight of 45% is applied on distance, while the remaining 55% is applied on PCI (20%) and COG (35%). On the intensive margin, only the PCI variable is used because distance and COG are effectively zero for products where Namibia already has a revealed comparative advantage. For all products considered in both the intensive and extensive margin, a minimum threshold of PCI>-0.93 (Namibia’s Economic Complexity Index by 2018) is set to safeguard that identified products would favorably contribute to Namibia’s economic complexity.
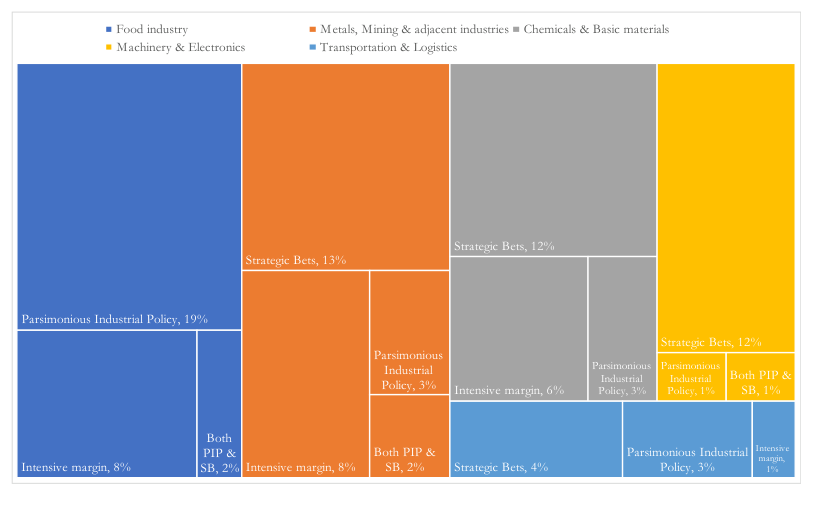
The process aims to identify the top 50 products from the intensive margin 9 and the top 100 products from the extensive margin (Top 50 under each of the PIP and SB approximations). 10 Figure 12 and Figure 13 show how the different extensive margin approximations end up prioritizing different types of products given the differential weights allocated to the Economic Complexity metrics. At this point, we consolidate findings across the different approximations and classify identified products into groups of related economic activities or diversification themes. 11 This yields a final list of 97 products, which are drawn from the intensive and extensive margins, and are organized into 5 cohesive themes.
19 | Economic complexity report: A roadmap for productive diversification in Namibia
Figure 12. Top 50 Products Identified Based on Parsimonious Industrial Policy Approach
4.3 Potential themes of diversification opportunities
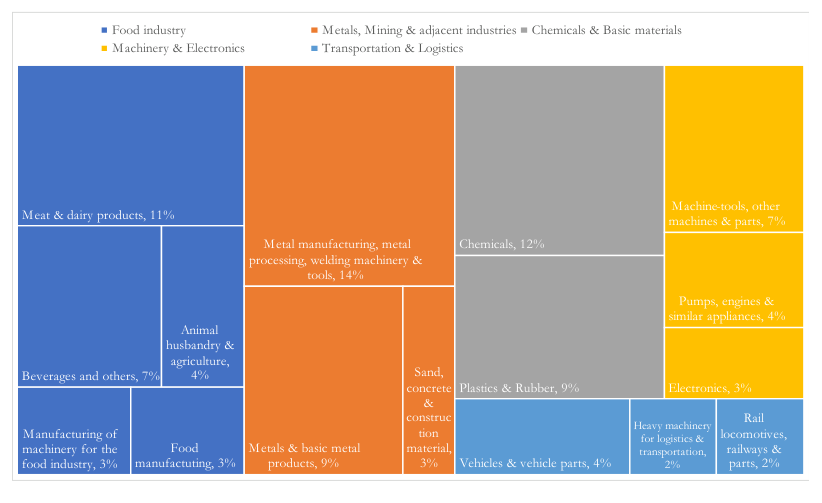
The five diversification themes that encompass the preliminary identified diversification opportunities for Namibia include: 12 (i) Chemicals & basic materials, (ii) Food industry, (iii) Machinery and electronics, (iv) Metals, mining & adjacent industries, and (v) Transportation and logistics. Figure 14 highlights the relative prevalence of each of these sub-themes and how they could be divided into narrower sub-themes. Figure 15 highlights the relative prevalence of industries in the intensive margin and the extensive margin within each of these themes. 13
20 | Economic complexity report: A roadmap for productive diversification in Namibia
Figure 14. Treemap of Diversification Themes and Sub-Themes
21 | Economic complexity report: A roadmap for productive diversification in Namibia
5. Complementary perspectives on diversification opportunities
5.1 Scope of the exercise
Having identified potential diversification opportunities, it may be beneficial to tease out further both the strategic opportunity they offer and the challenges inherent to their development. In particular, it can be useful to evaluate, through complementary metrics, how feasible and attractive each diversification opportunity can be, given the challenges faced by Namibia, it’s comparative advantages, strategic priorities and features of its labor-market and geography.
In this section, we offer a preliminary set of feasibility and attractiveness factors to foster a broader discussion around this complementary approach. These factors have been defined based on the Growth Lab’s experience, data availability, our interactions with stakeholders.
This analysis could be useful not only to assess in a more tangible manner the challenges and upside associated to diversification opportunities, but it could also be leveraged as an input for further prioritization efforts. Namely, even within the narrower set of opportunities identified through the Economic Complexity methodology efforts may be focused further on the sub-set of industries which offer more tangible upside and imply less explicit challenges to its development.
5.2 Potential complementary feasibility and attractiveness factors
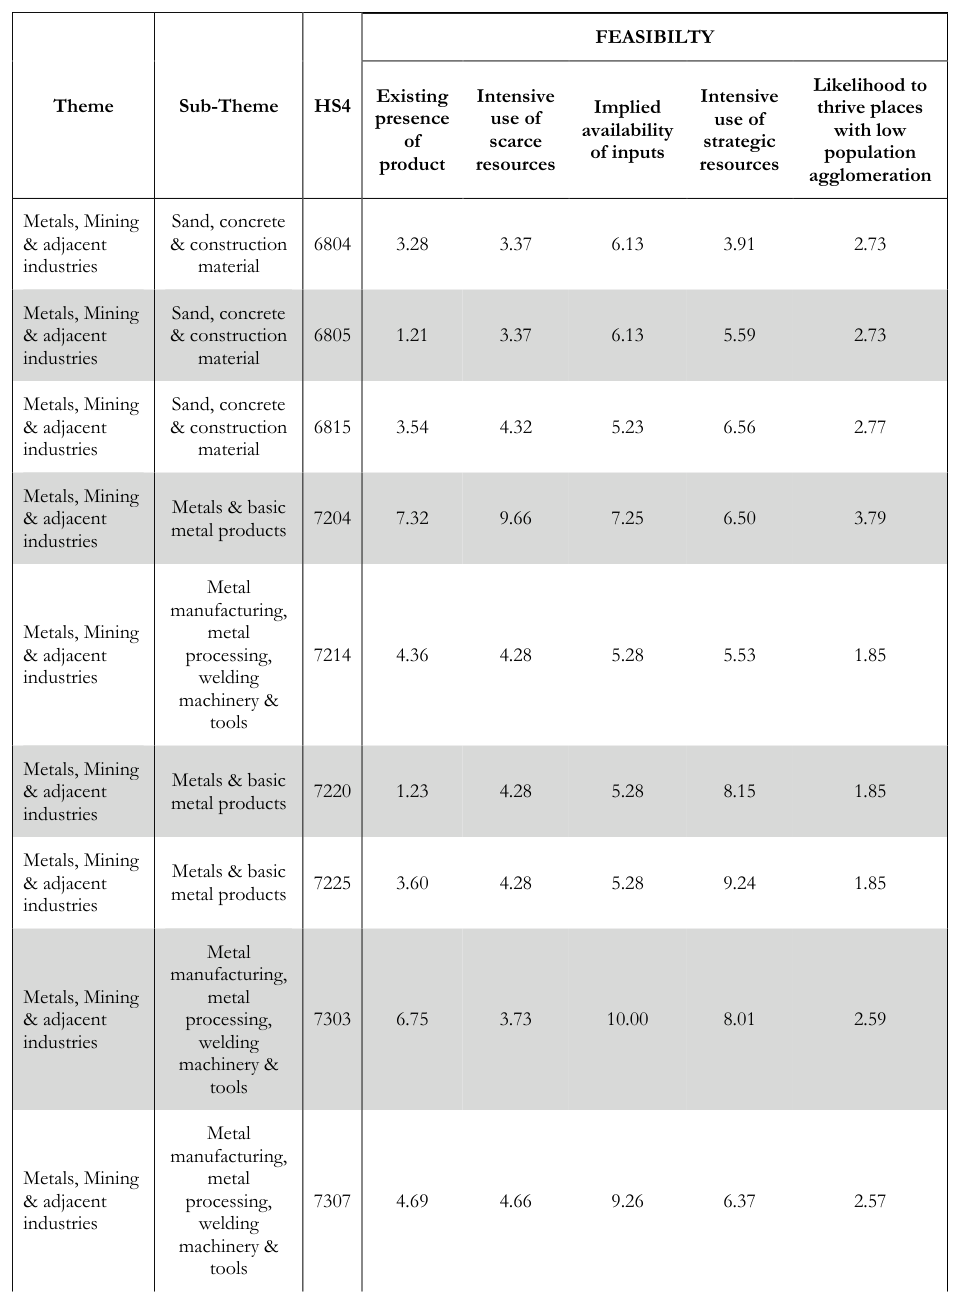
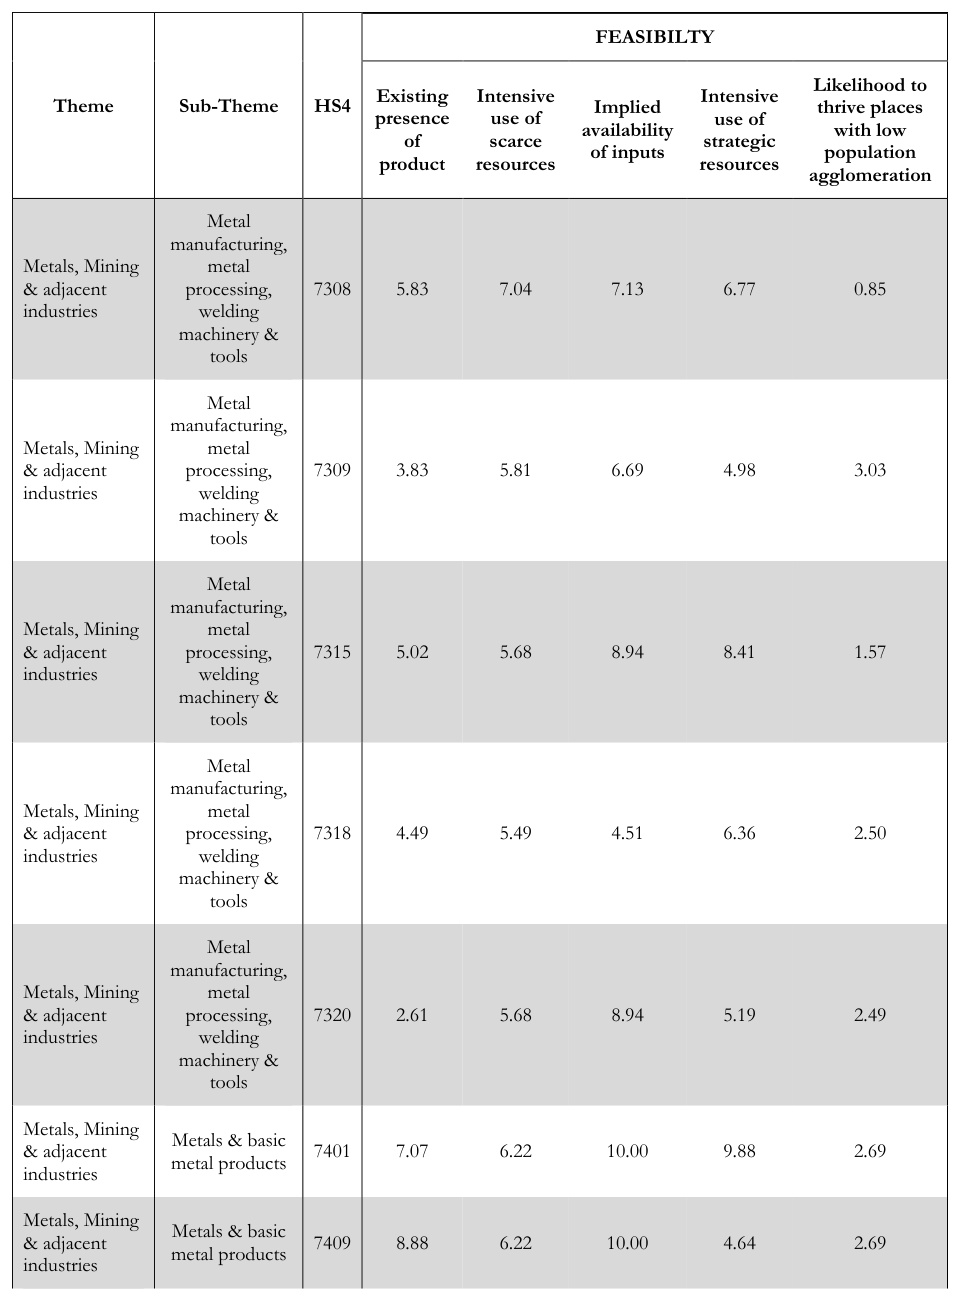
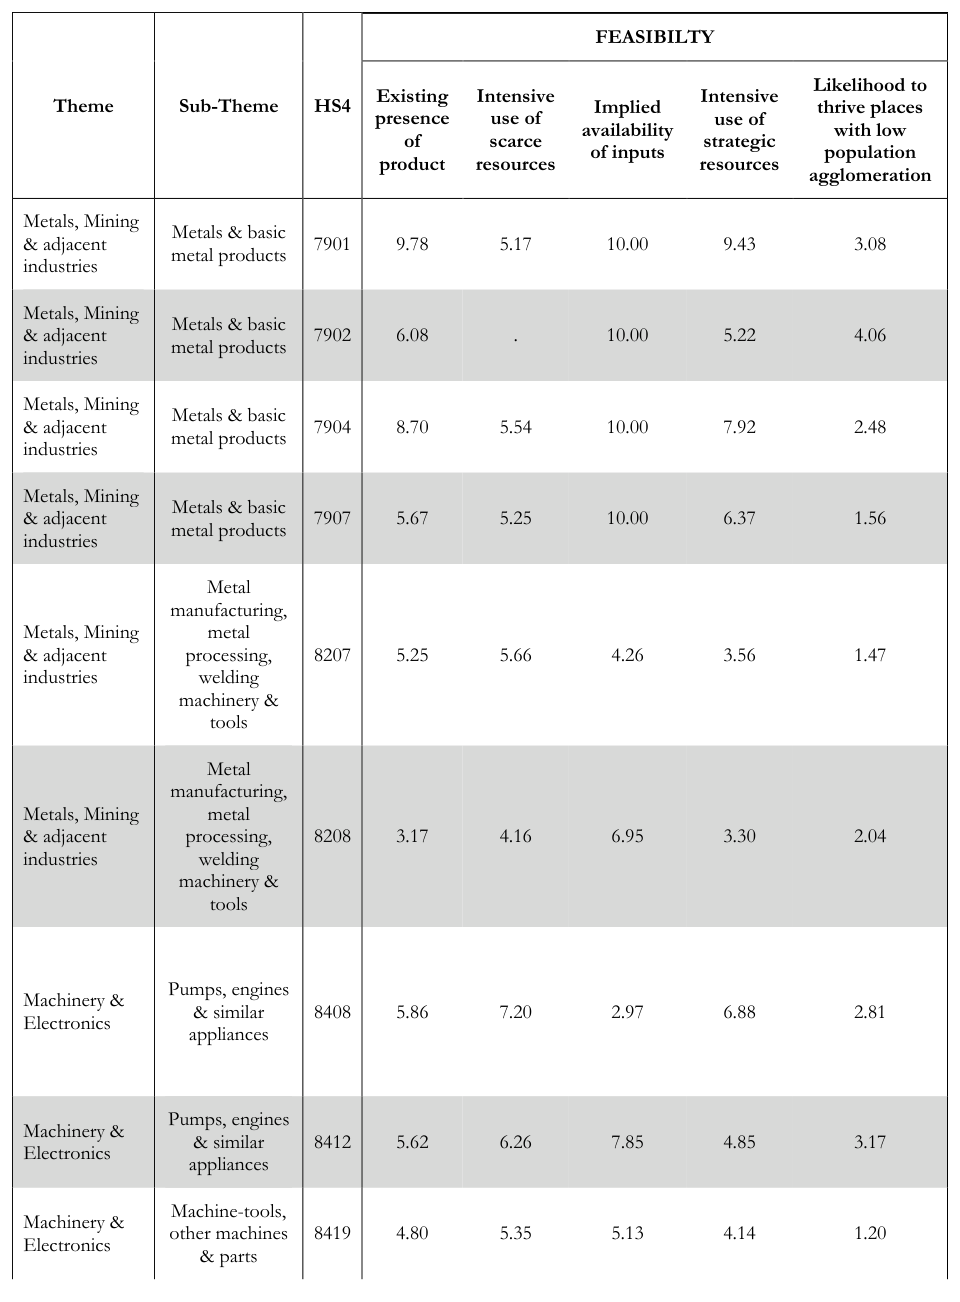
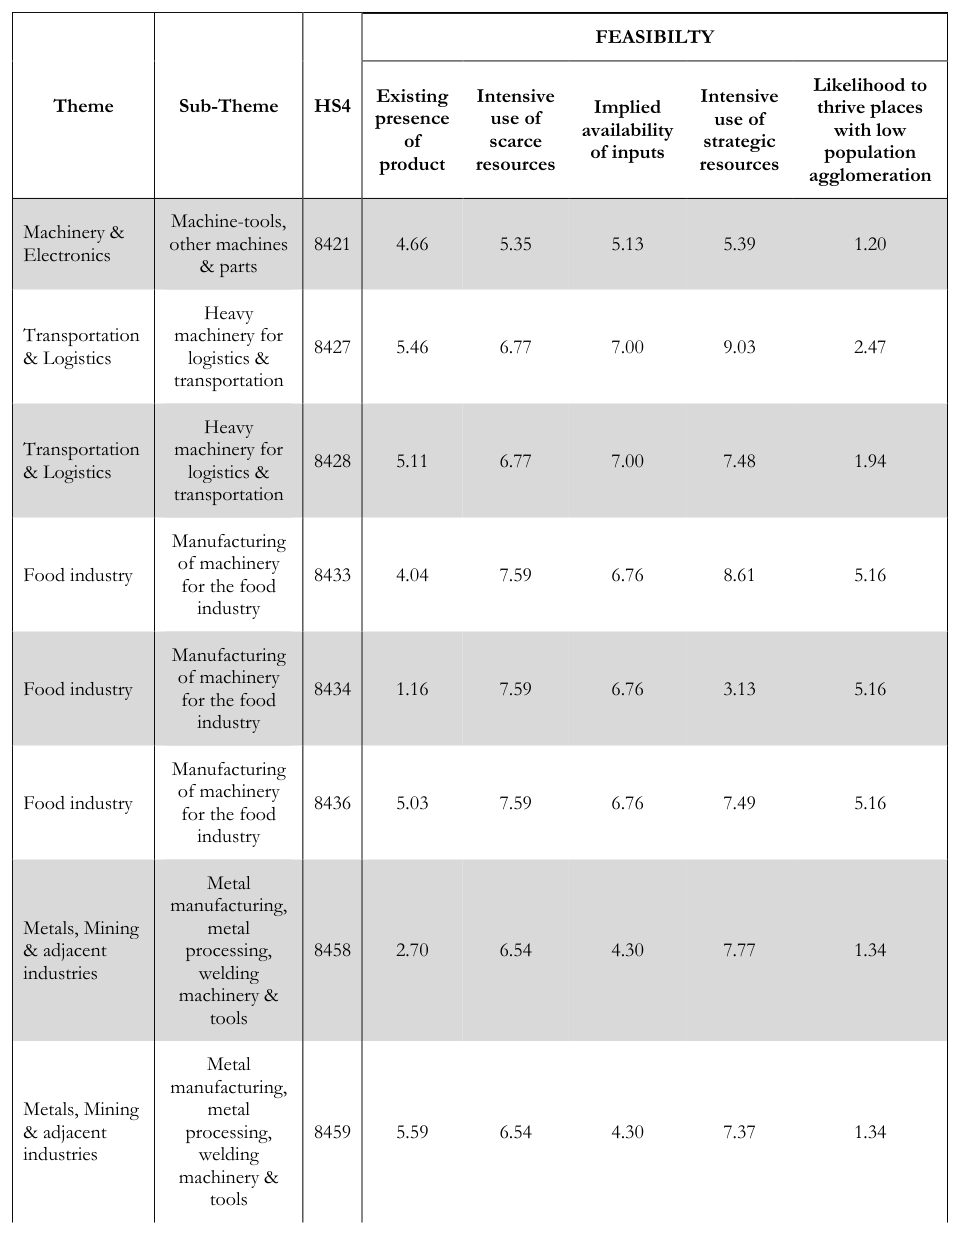
Below we briefly describe the feasibility and attractiveness factors leveraged to assess, evaluate, and refine the previously identified list 97 products. Feasibility factors aim to measure whether a given industry or product is more likely to thrive in Namibia, whereas attractiveness factors aim to measure how desirable a given industry or product is based on various policy-relevant criteria.
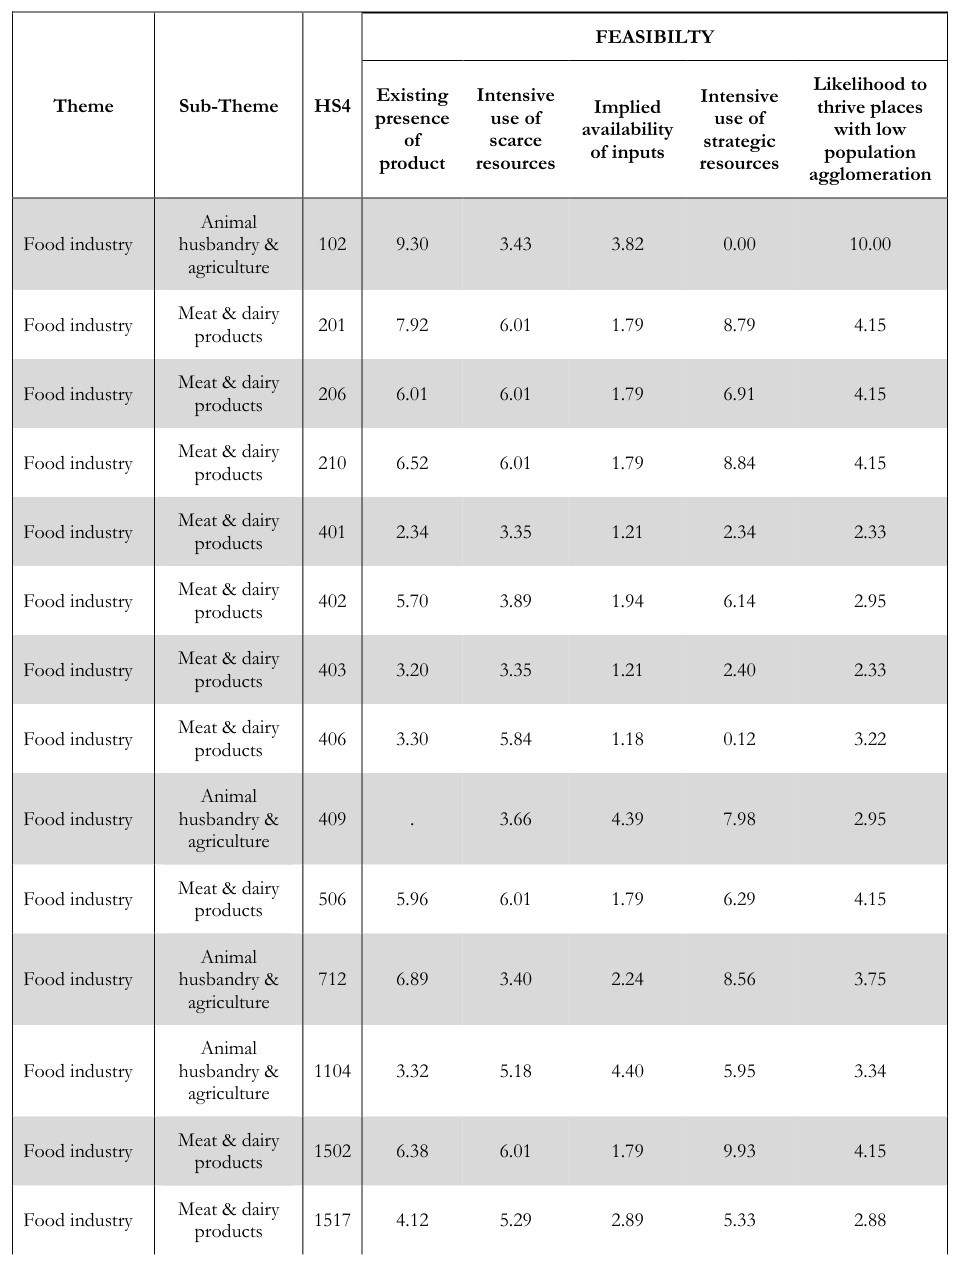
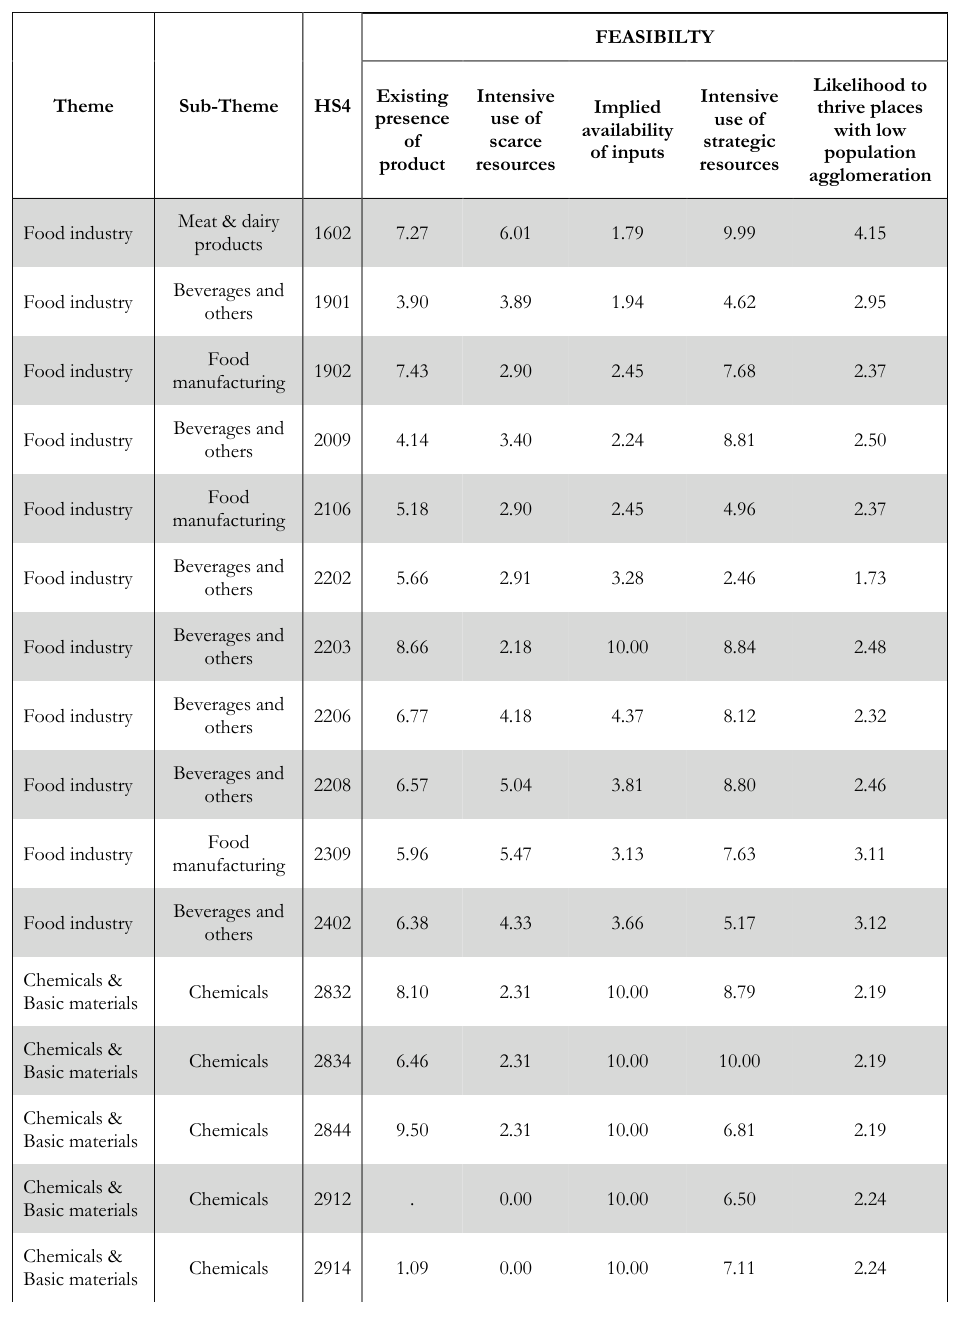
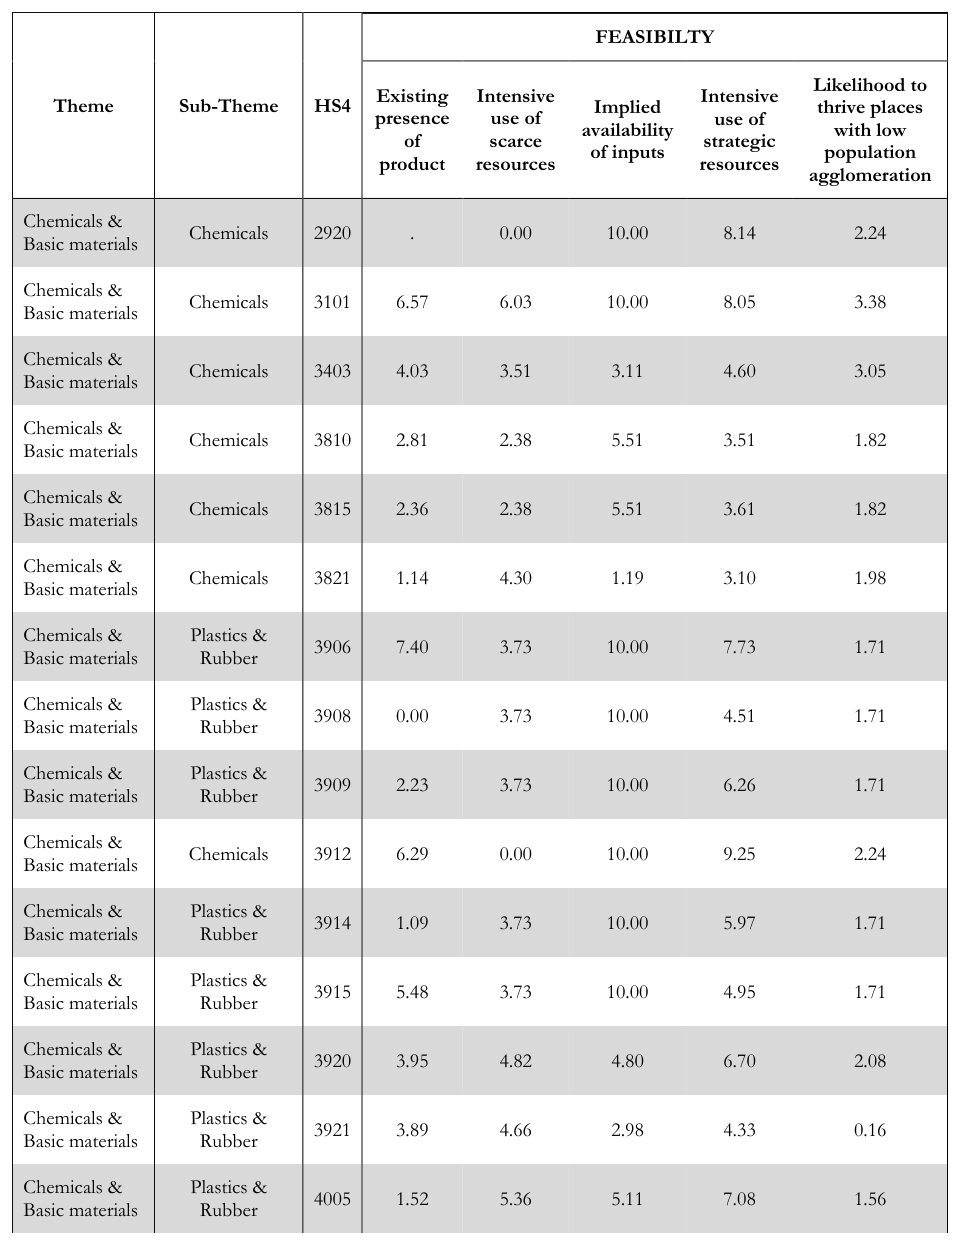
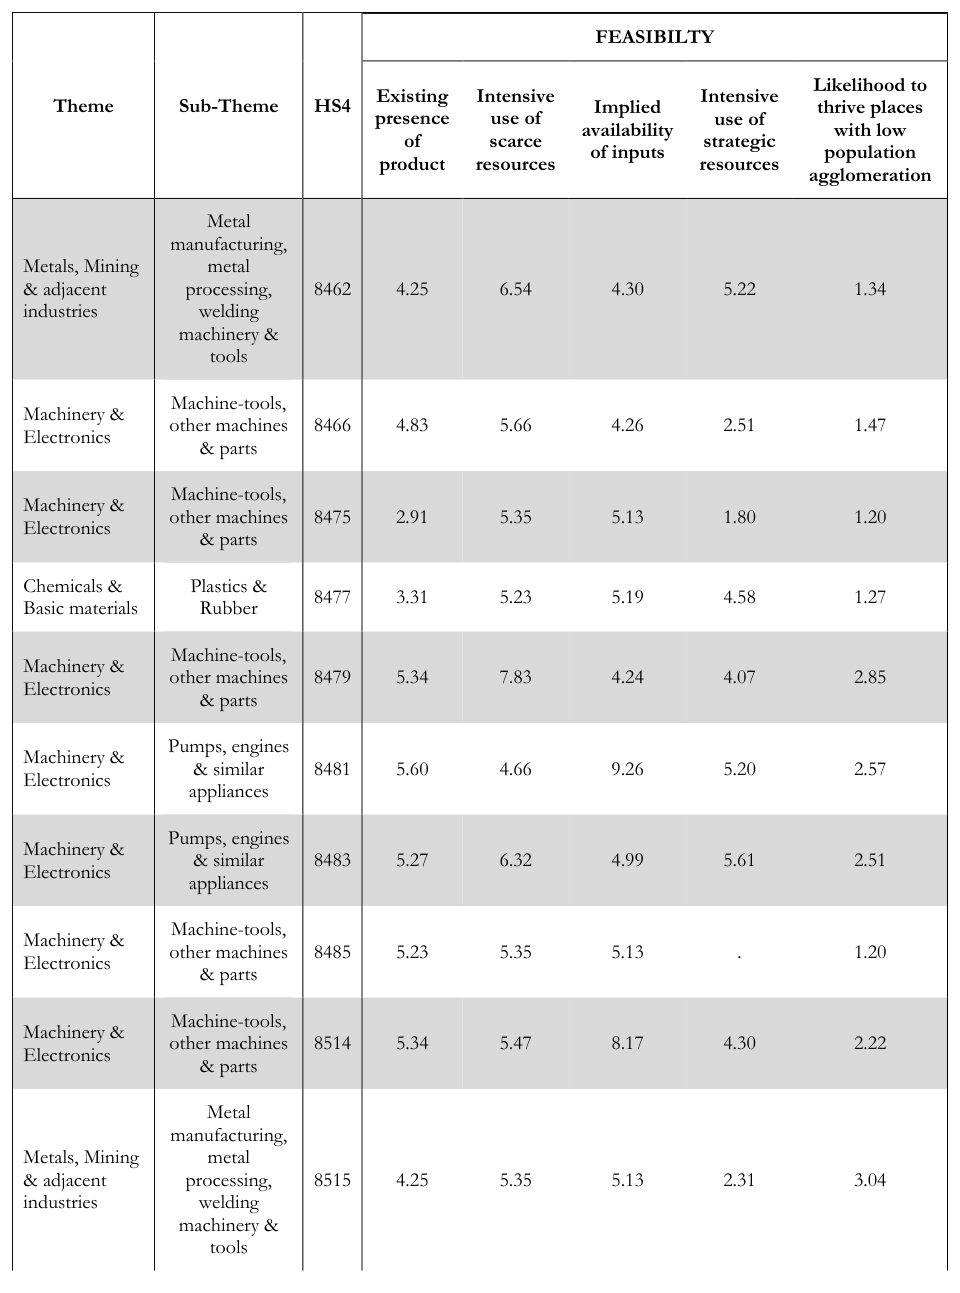
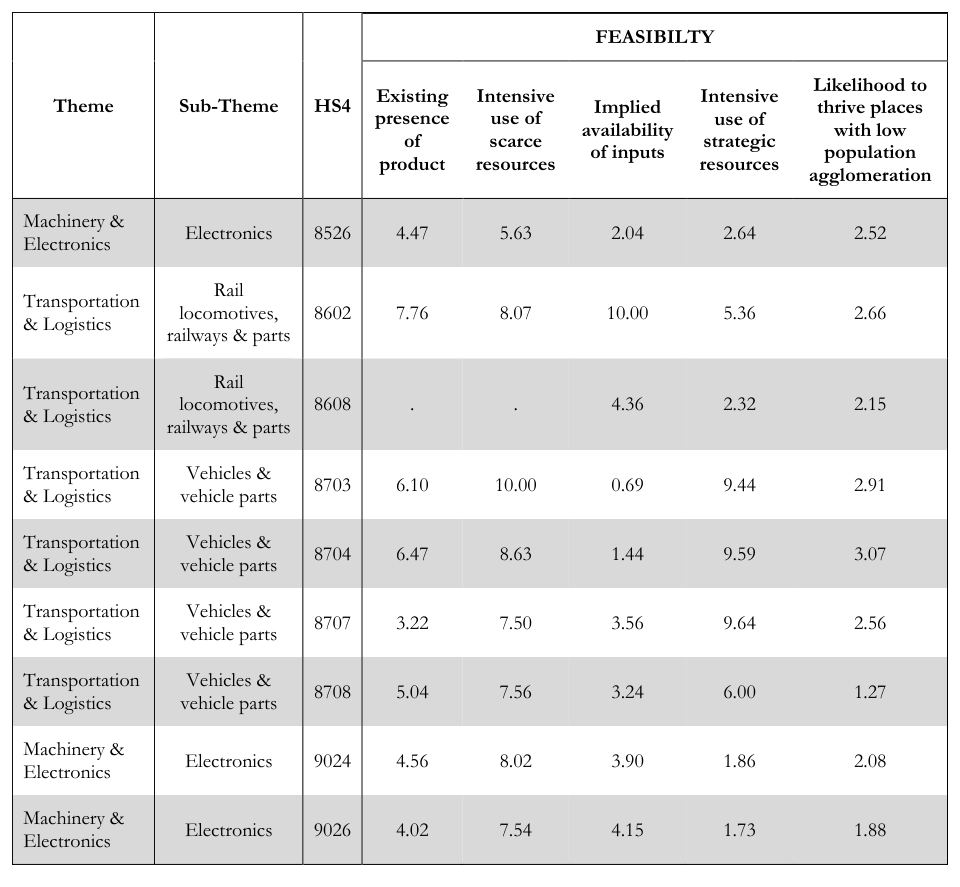
Proposed feasibility factors • Existing presence. A prospective product is more likely to thrive in Namibia if it is already produced with some intensity. We can use two metrics to assess whether a product is already present drawing from the Atlas of Economic Complexity. First, we measure product existence by using an RCA value. Second, we can use export values to assess whether Namibia currently exports a good with a positive value. To smooth out variation, RCA and export values were calculated by averaging years 2016, 2017 and 2018, our three most recent years of data. • Intensive use of scarce resources. Namibia faces a unique challenge given its aridity and vast desert land. Because of this, products that are intensive in scarce resources – most notably, water – are less likely to thrive in the country. 14 To calculate water use intensity, input-output matrices from the United States of America (USA) were used to estimate their intensity in the use of water. 15 14 See Hausmann, R., Santos, M.A., Barrios, D., Muci, F., Taniparti, N. Tudela, J. (2021). The report does not identify water as a binding constraint, mainly because despite significant scarcity demand did not seem to outweigh supply. Having said that, water availability was highlighted as a potential constraint for certain water-intensive industries in certain parts of the country. Hence, it may be worthwhile to deprioritize diversification opportunities that may face the same type of challenges given their high water intensiveness. 15 The implicit assumption here is that these are industry characteristics that should, when fully developed, have external validity across borders. The USA is used frequently as a reference point both because of its ample diversity of industries in which it is specialized, and for the relative ease in building concordances across industry classifications that cover exports, use of inputs, FDI attraction, employee characteristics, etc.
22 | Economic complexity report: A roadmap for productive diversification in Namibia
• Implied availability of inputs. Products will be more likely to thrive in Namibia if they share inputs with industries that already exist in the country. This includes availability of physical resource inputs as well as availability of human capital. To measure the extent to which certain products share inputs with others that already exist in Namibia, we calculated the share of inputs that are intensively demanded by prospective industries that are either part of Namibia’s productive matrix or that are intensively demanded by products in Namibia’s productive matrix. A similar calculation was conducted to measure shared occupations by finding the share of occupations intensively demanded by prospective industries that are also intensively demanded by products in Namibia’s productive matrix. 16 A combination of Atlas data, USA input-output data, 17 and USA Bureau of Labor Statistics employment data 18 was used in this calculation. More information about this calculation can be found in Annex 5 and Annex 6. • Intensive use of strategic resources. While some resources are scarce in Namibia, others are relatively more abundant and represent a key comparative advantage. An important strategic resource is its newly expanded port and favorable logistical infrastructure. Because of this, it is possible that products that have a higher propensity of being imported by sea are more likely to thrive in the country. To calculate port export/import propensity, we assume that the European Union is the main prospective importer by sea of products that tend to ship from Namibia and sub-Saharan Africa. We used Eurostat data to calculate a sea import RCA by taking the ratio of the share of a given product imported by sea out of total imports of that product to the share of all products imported by sea out of total imports. • Likelihood to thrive in locations with limited population agglomeration. Because of Namibia’s low population density, prospective industries should be able to thrive even in areas with low agglomeration. To assess this factor, two parallel measurements were made using Dun & Bradstreet data. First, we assessed whether a given product is more likely to thrive in sparsely populated places by taking the coefficients from the correlation between county population size in the USA 19 and the RCA of the given product. Second, we assessed whether a given product is likely to thrive in isolated places by taking the coefficients from the correlation between geographic proximity to populated areas in the USA 20 and the RCA of the product.
23 | Economic complexity report: A roadmap for productive diversification in Namibia
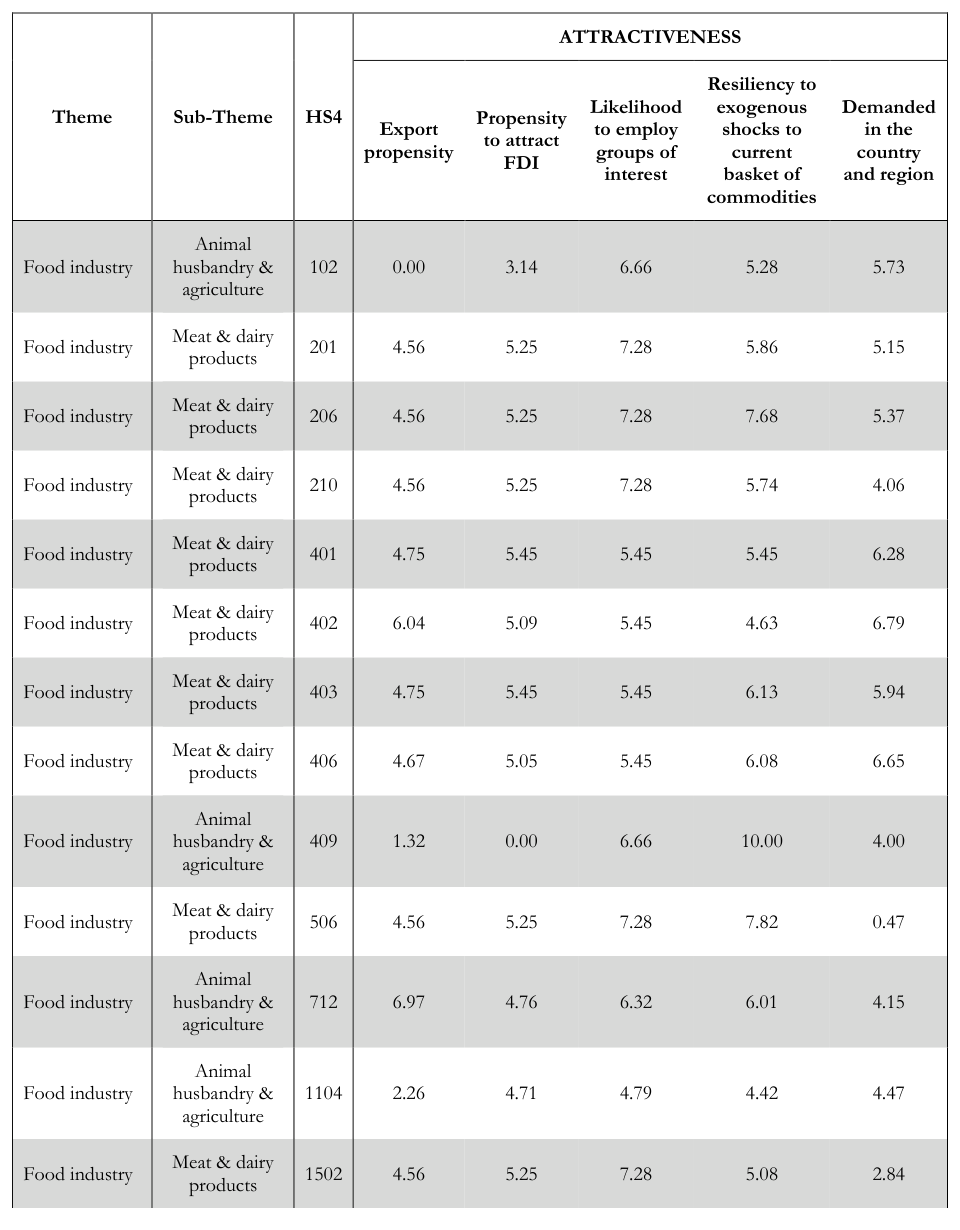
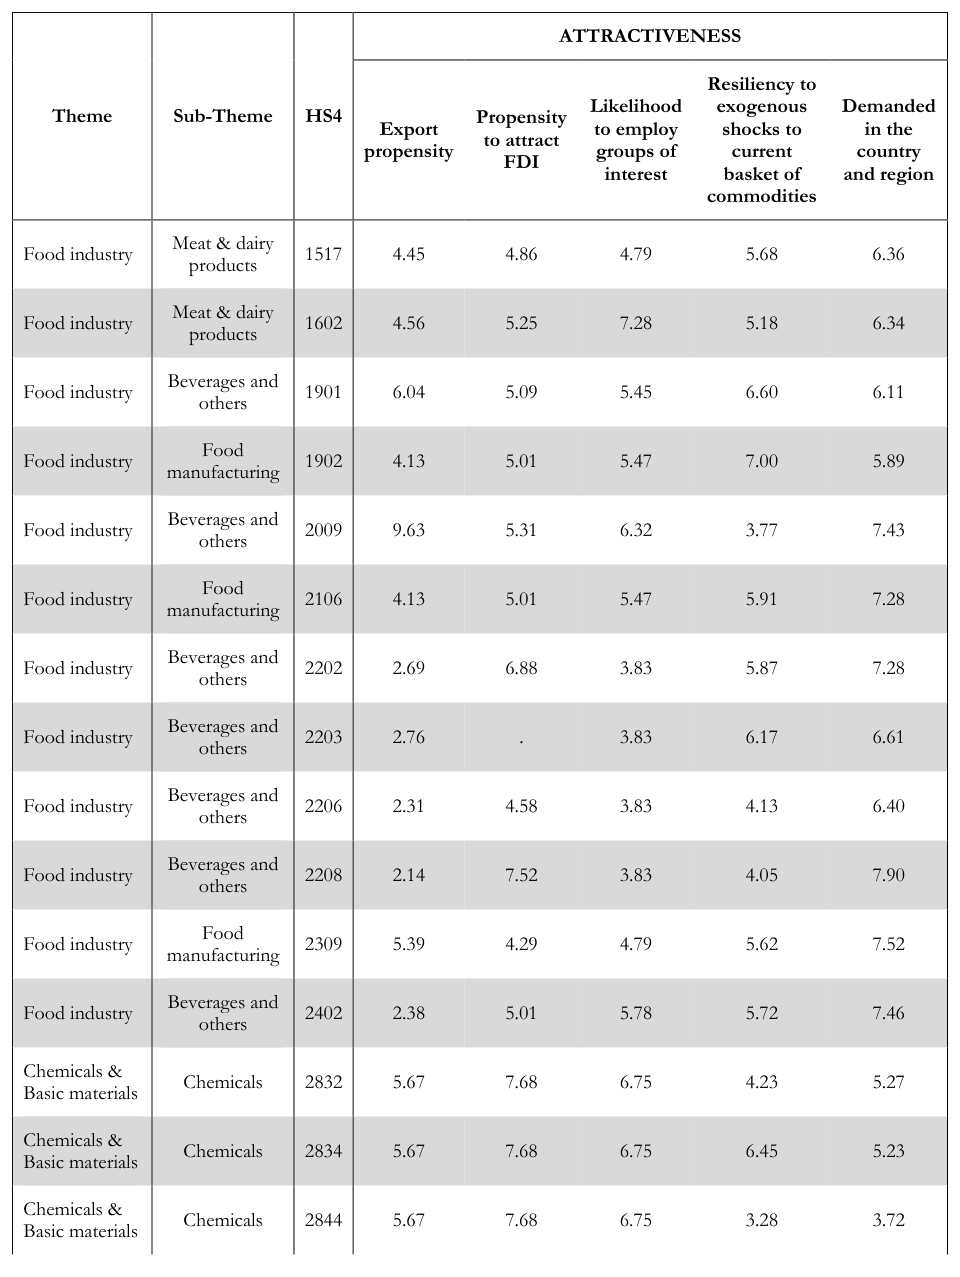
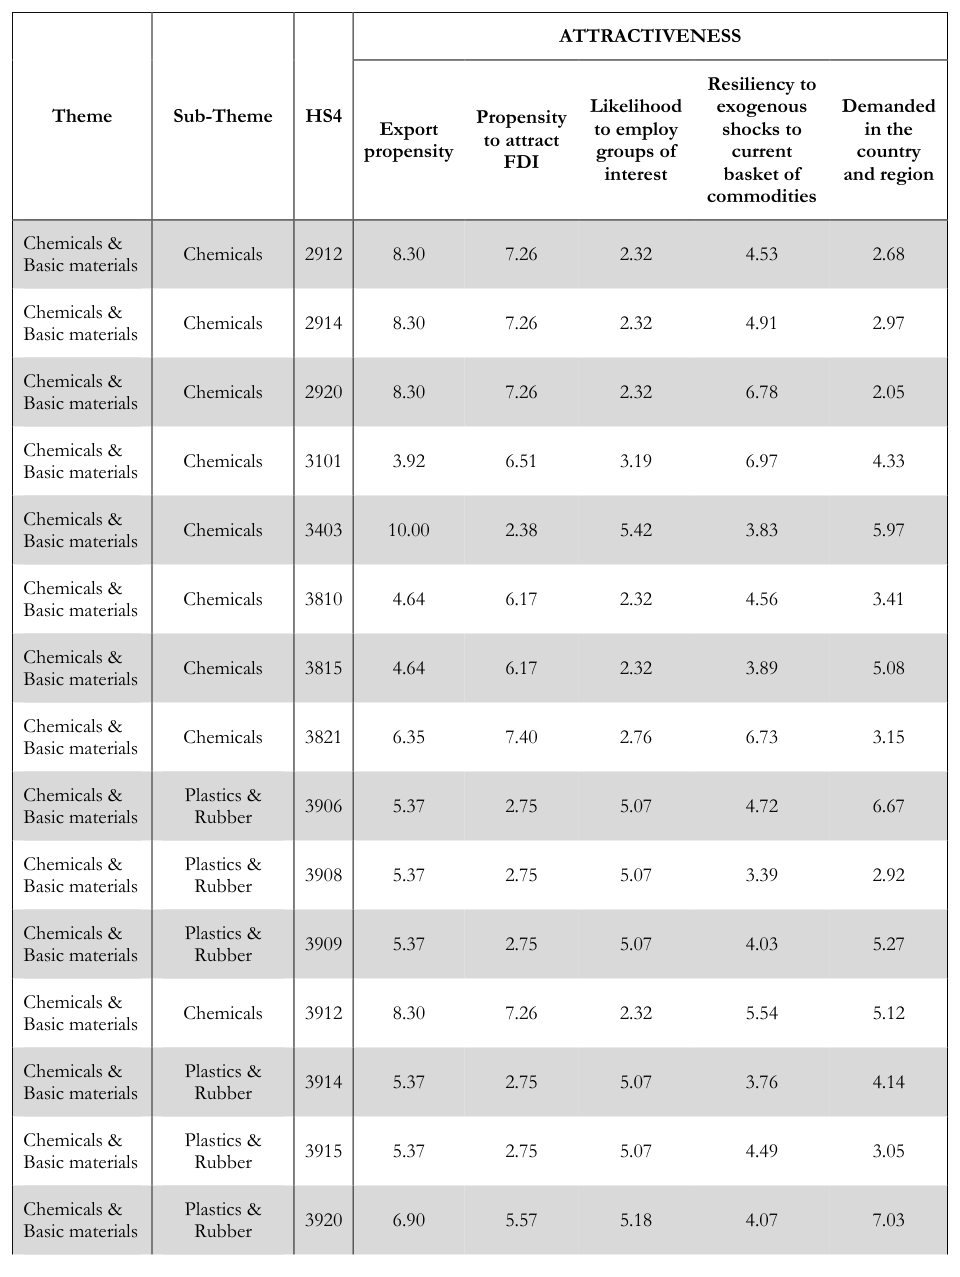
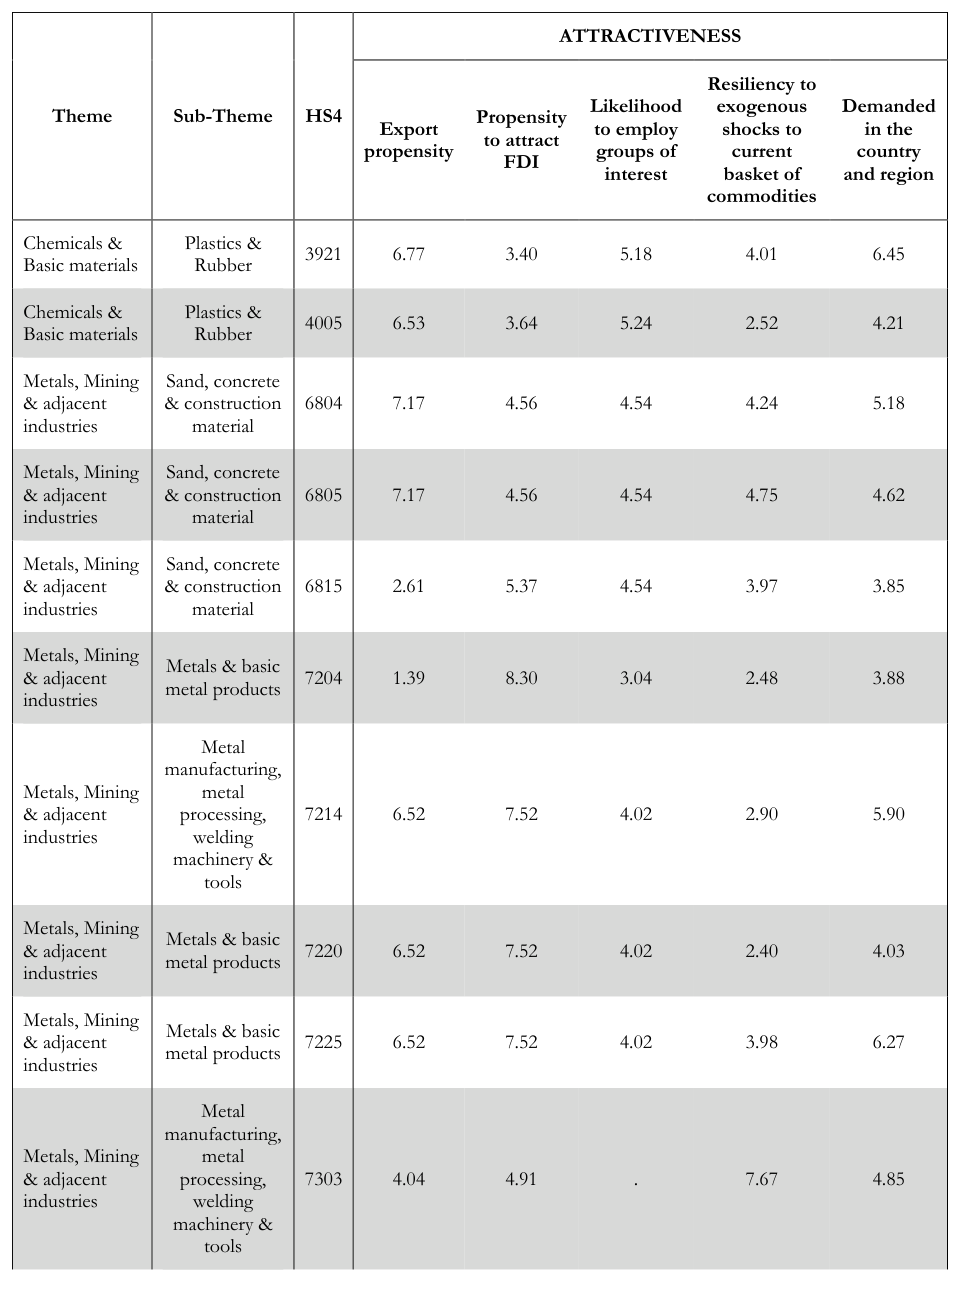
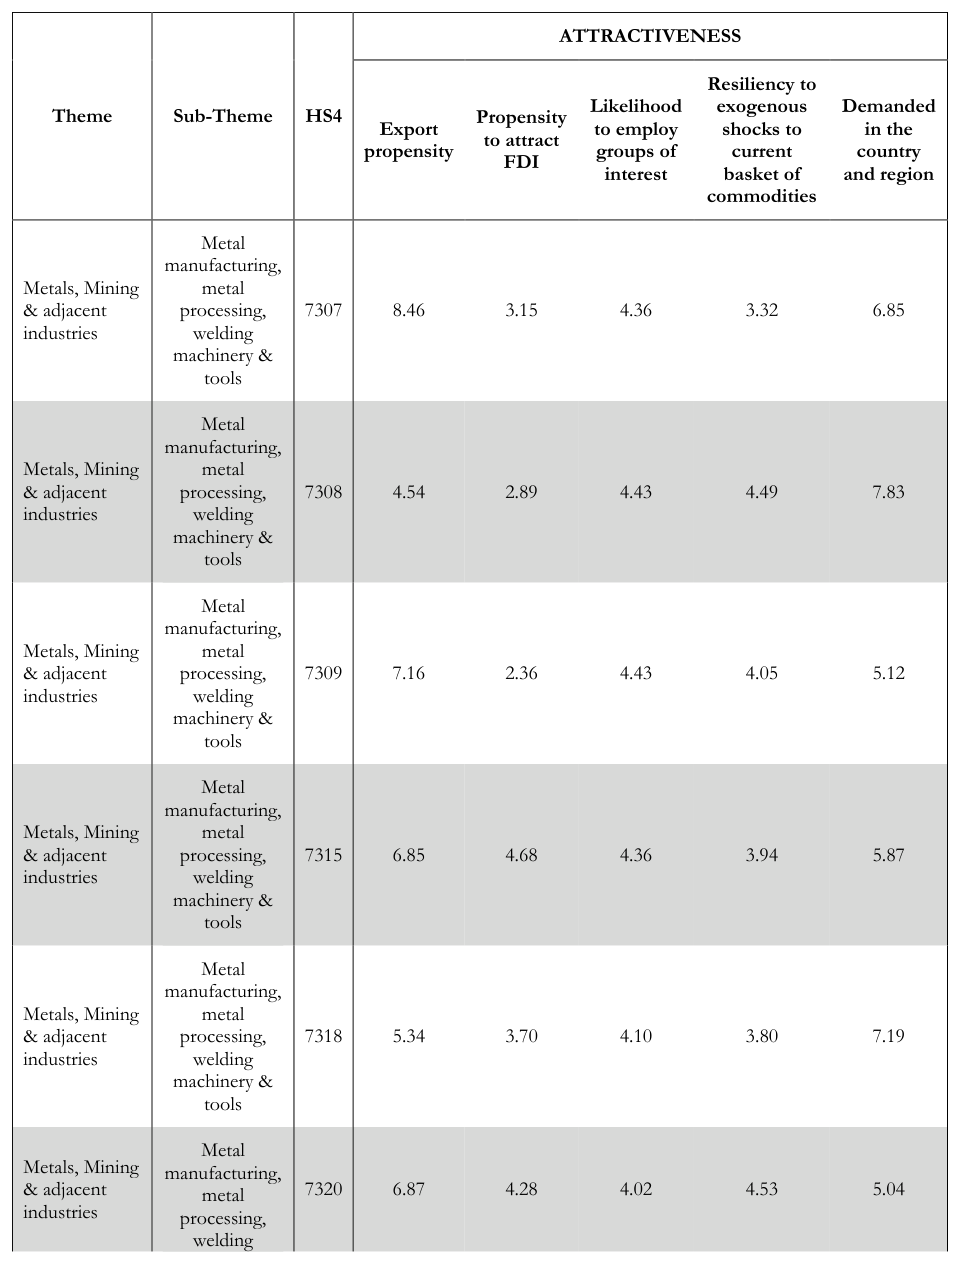
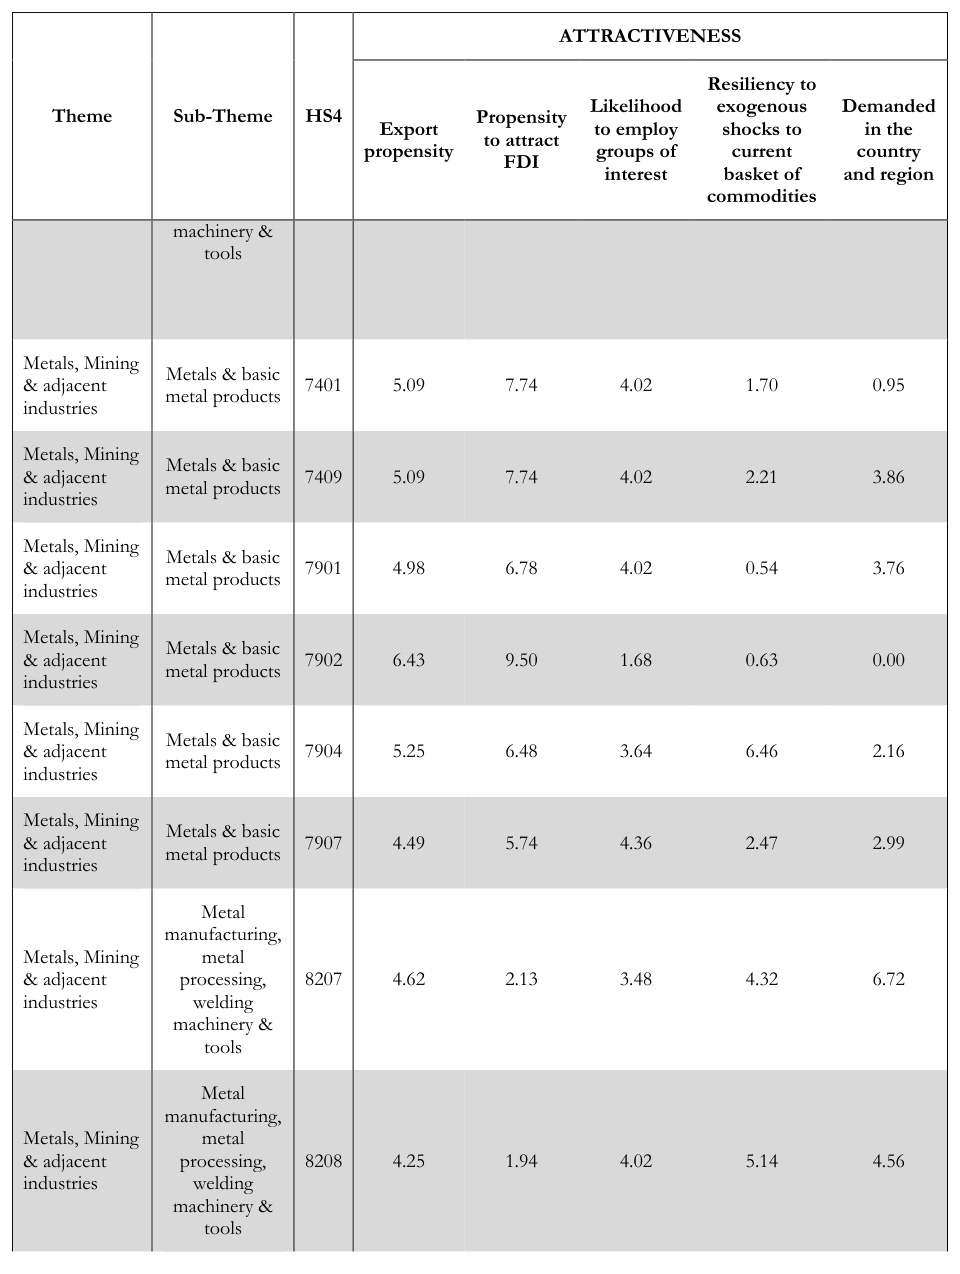
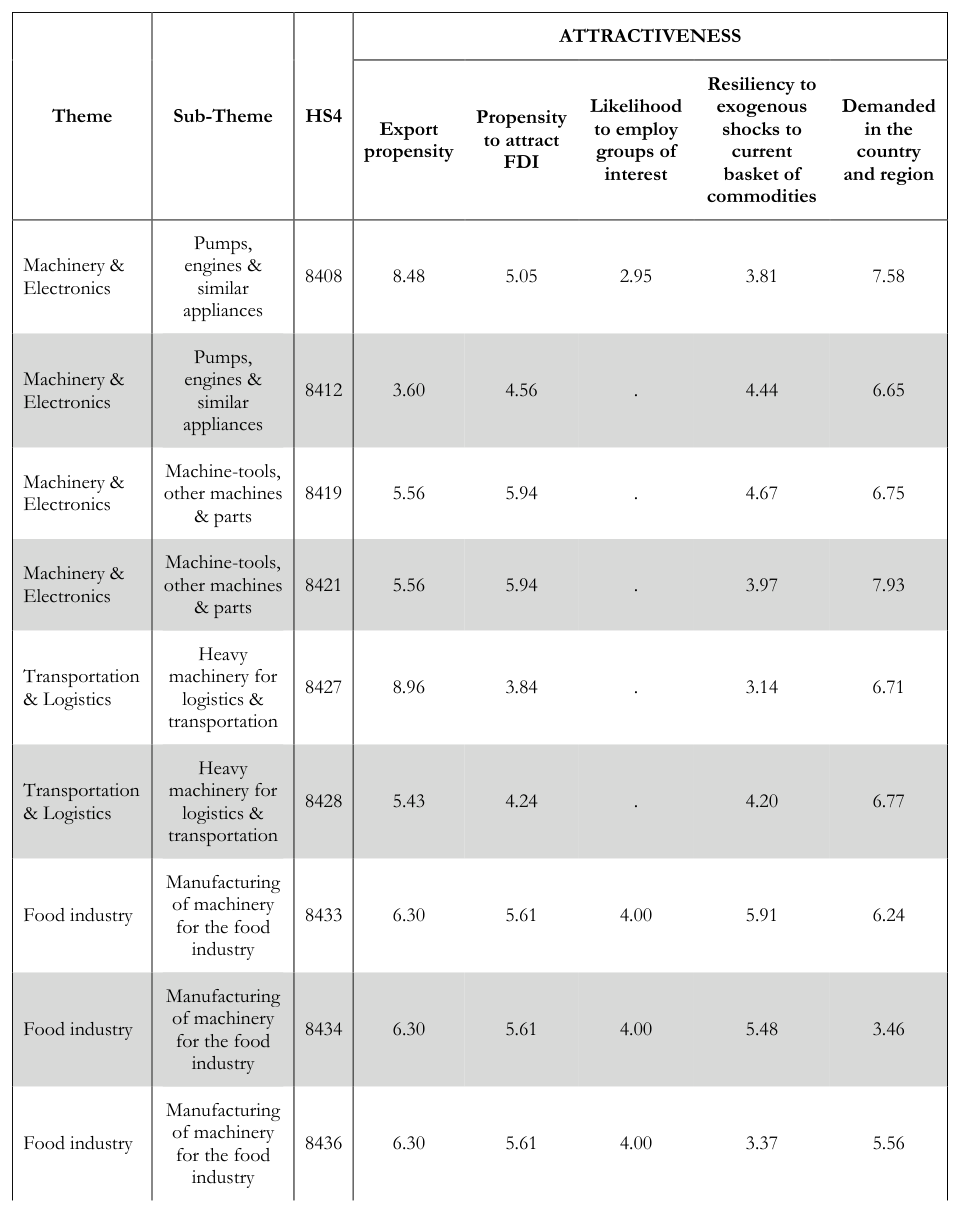
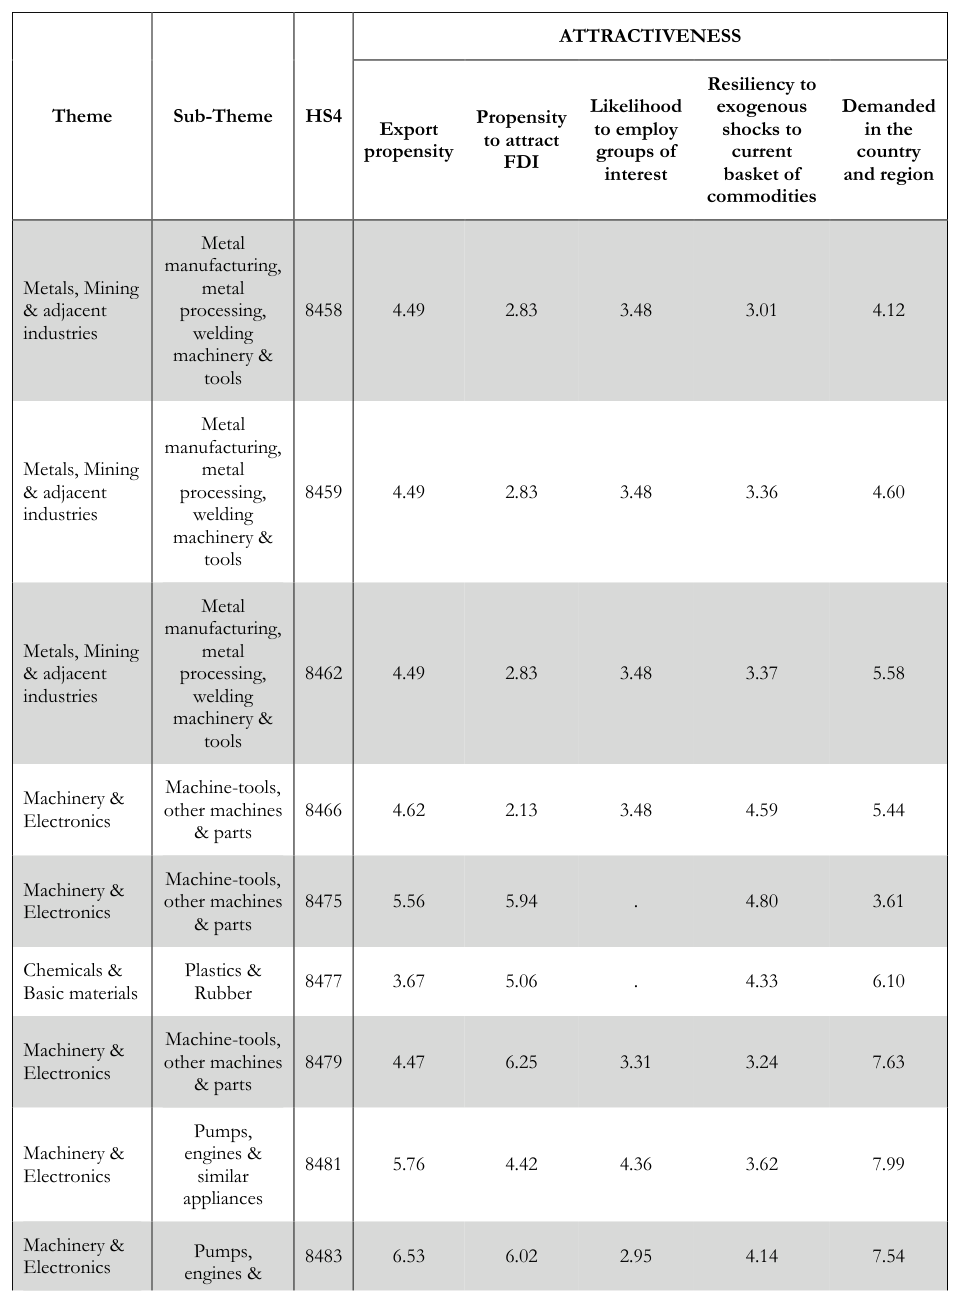
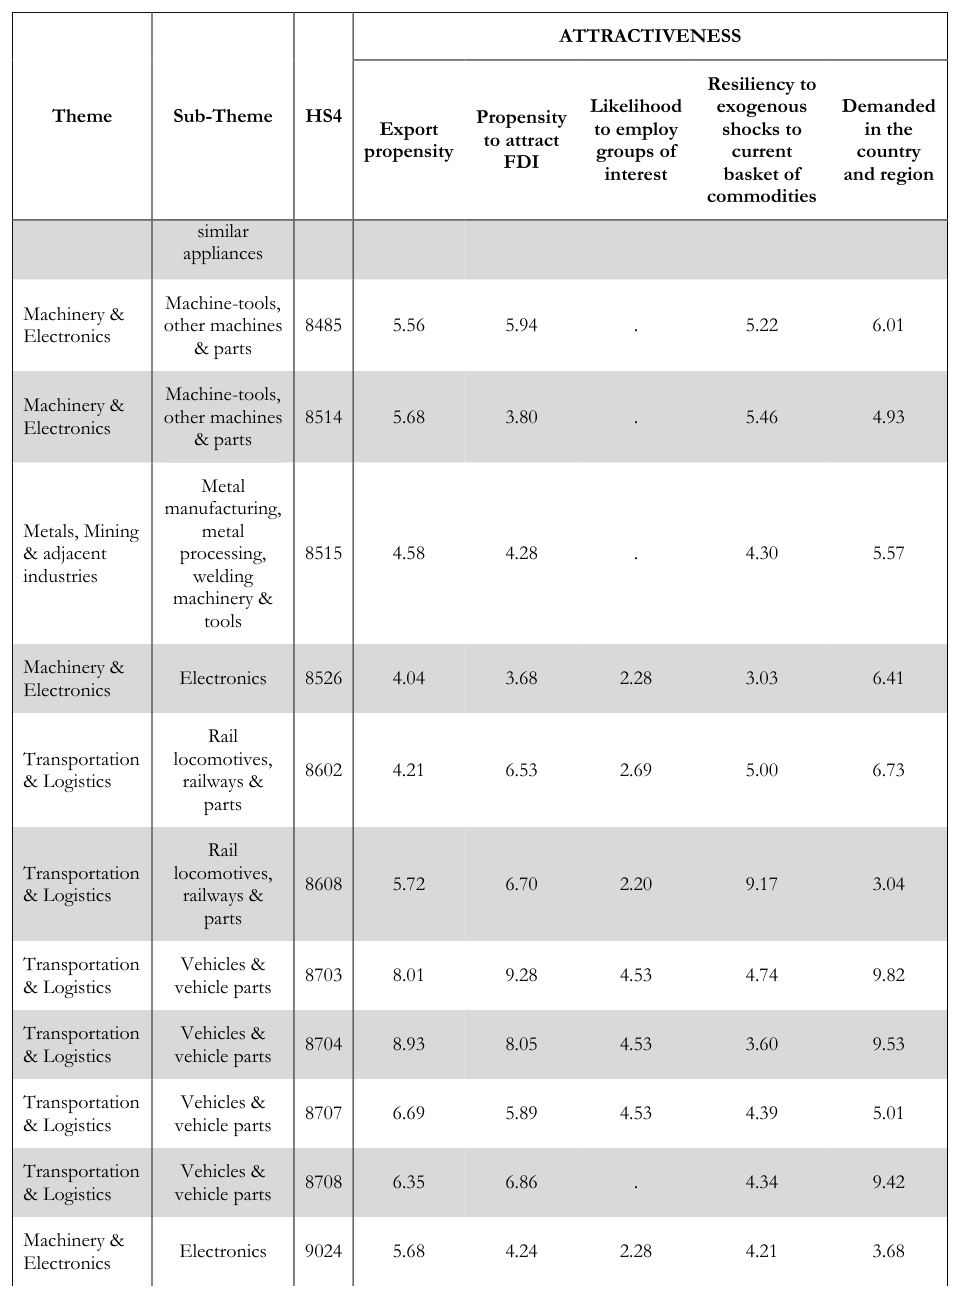
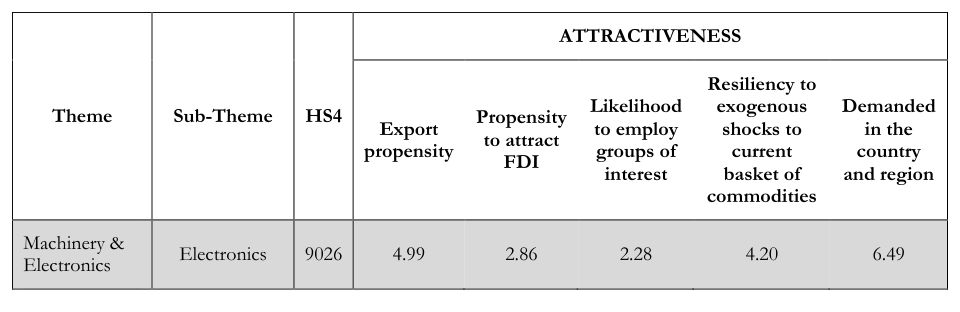
Proposed attractiveness factors • Export propensity. Given the limited scope for local demand, a given product may be more attractive if it allows Namibia to tap international demand. To assess whether a prospective product is likely to be exported, we calculate an export propensity score using Dun & Bradstreet data. We take the percentage of establishments in each product that self-report exports in the dataset and use this to estimate the likelihood that establishments engaged with the prospective product will export. • Propensity to attract FDI. Given that investment attraction is an important priority for Namibia, potential products may more desirable if there is evidence that they are likely to mobilize FDI. Because different regions and countries may attract different levels of FDI, an FDI attractiveness score by product was calculated looking at three recipient groups of interest using FDI Markets data: FDI flows to all countries, FDI flows to all international peers, 21 and FDI flows to regional and Southern African Customs Union (SACU) peers. 22 • Likelihood to employ groups of interest. Namibia faces high levels of unemployment and low levels of labor force participation, particularly among women, youth, and low-skill workers. Products that are more likely to employ these excluded groups may be more attractive to the country. We use USA 23 census and Integrated Public Use Microdata Series (IPUMS) survey data to find three shares: the share of employees in each good or activity that are female, the share of employees that are between the ages of 15 and 24, and the share that have lower than a tertiary level of education as an imperfect proxy for low-skill employment. To smooth volatility, the averaged shares for years 2017, 2018, and 2019. • Resilience to terms of trade volatility. Namibia’s exports and economy are sensitive to price fluctuations for specific commodities. Products that face a demand pattern largely uncorrelated with that of these commodities, may help smooth terms of trade volatility or at least increase economic resilience. We estimated the sensitivity of exports of all products to fluctuations in the price of commodities in Namibia’s current export basket. The resulting index captures strength of this association, and therefore how much each product might be independent to exogenous shocks faced by Namibia’s main commodities. 24 • Extent of demand in the country and in the region. Products are likely to be attractive to Namibia if they are demanded by nearby markets. That may enable nascent activities to achieve sufficient scale. For these products, Namibia has the potential to displace or add to what is currently being imported. To proxy regional demand, we examine the products that are imported by Namibia as well as the products that are imported by nearby countries (the SACU countries and regional peers Angola and Zambia) using data from the Atlas of Economic Complexity. Again, to smooth volatility, we averaged numbers from 2016, 2017, and 2018.
24 | Economic complexity report: A roadmap for productive diversification in Namibia
5.3 Normalization and visualization of complementary factors
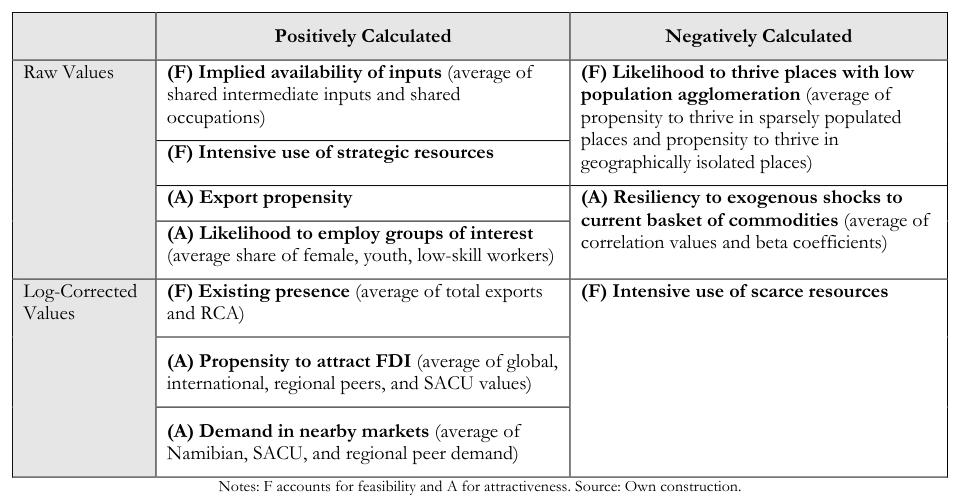
To facilitate aggregation and comparison across indicators and products, we normalized the calculations for each of the factors described above into a scale of 0 to 10. Given the various distributions of the values that emerged from the calculations for each factor, slightly different normalization techniques were employed. First, some factors had values that were distributed normally or within bounds, while other factors had values that were clustered with long tails. To ensure that these factors with skewed distributions had scores that could be adequately distributed in the 0 to 10 range, the raw values from these factors were transformed using logs.
Second, some factors should have higher scores if the factor value is high, while other factors (i.e. export propensity) should have higher scores if the factor value is low (i.e. intensity in the use of scarce resources). For factors for which a higher value was more desirable, normalization of value i for factor f was calculated using the formula:
ssssssssss ii,ff = vvvvvvvvvv ii − mmmmmm ff mmmmmm ff − mmmmmm ff ssssssssss ii,ff = mmmmmm ff − vvvvvvvvvv ii For factors for which a lower value was more desirable, the inverse equation was used:
mmmmmm ff − mmmmmm ff Some of the factors had multiple sub-pillars that contributed to the score. For these factors, a simple average was taken across sub-factors. The table below provides a summary of how each factor was calculated based on the two considerations described above. Full details on the resulting scores of each factor for each product can be found in Annex 2 and Annex 3.
Table 1. Summary of Normalization Techniques for Feasibility and Attractiveness Factors
25 | Economic complexity report: A roadmap for productive diversification in Namibia
5.4 Product example
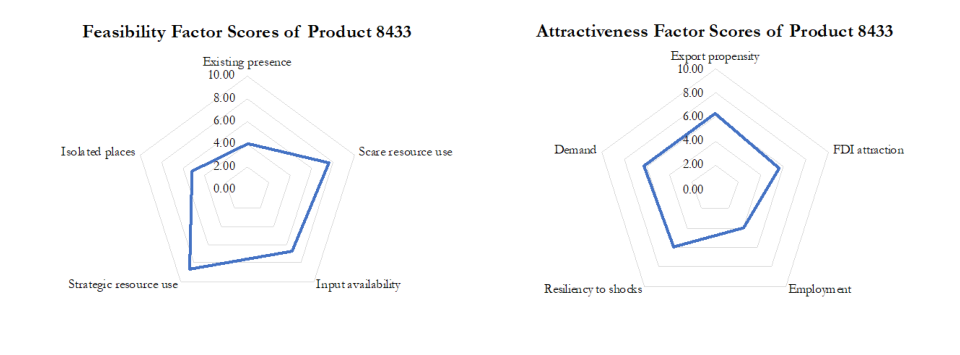
The normalization process facilitates the visualization of how each specific factor influences the feasibility and attractiveness of each product. For example, Figure 16 below depicts the normalized score for each feasibility and attractiveness factor for code HS8433: Harvesting or threshing machinery. Focusing first on feasibility, this specific type of farming machinery performs well in terms of using more of Namibia’s strategic resources, while relying less on the country’s scarce resources. It also performs well in terms of sharing many of the current intermediate inputs and occupations that exist in Namibia. However, it does not currently have a strong presence in Namibia, nor does it perform especially well in places with low population agglomerations.
Turning our attention to the attractiveness’ scores, HS8433: Harvesting or threshing machinery performance seems to be relatively close to the average. However, it has a particularly low score in employing groups of interest. Overall, the product’s relative performance on these feasibility and attractiveness might inform the decision to prioritize or not efforts around its development.
Figure 16. Feasibility and Attractiveness Scores for HS8433: Harvesting or Threshing Machinery
5.4 Input for potential prioritization
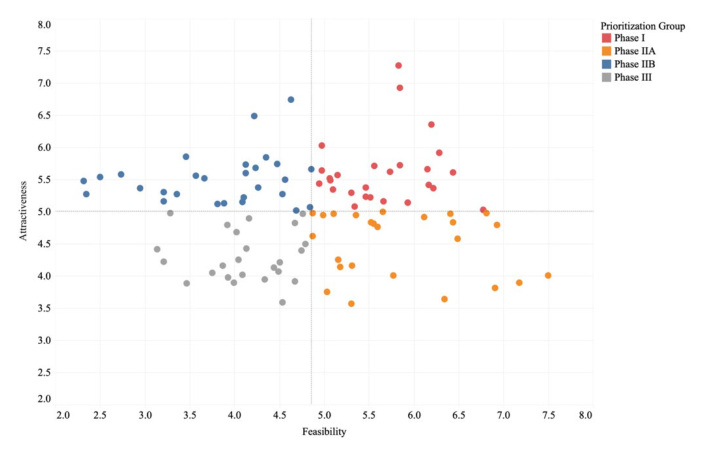
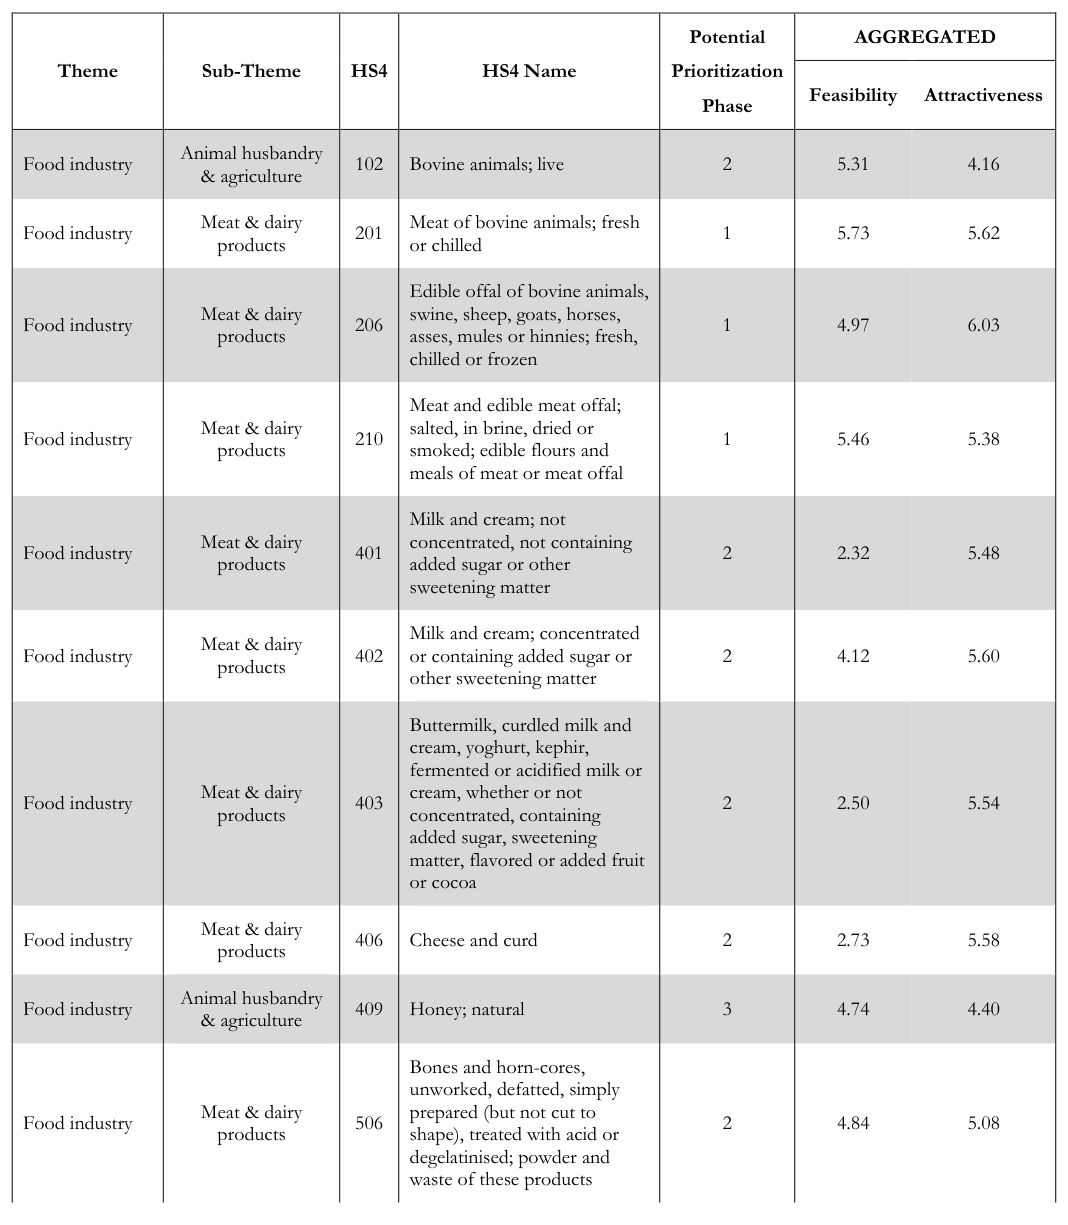
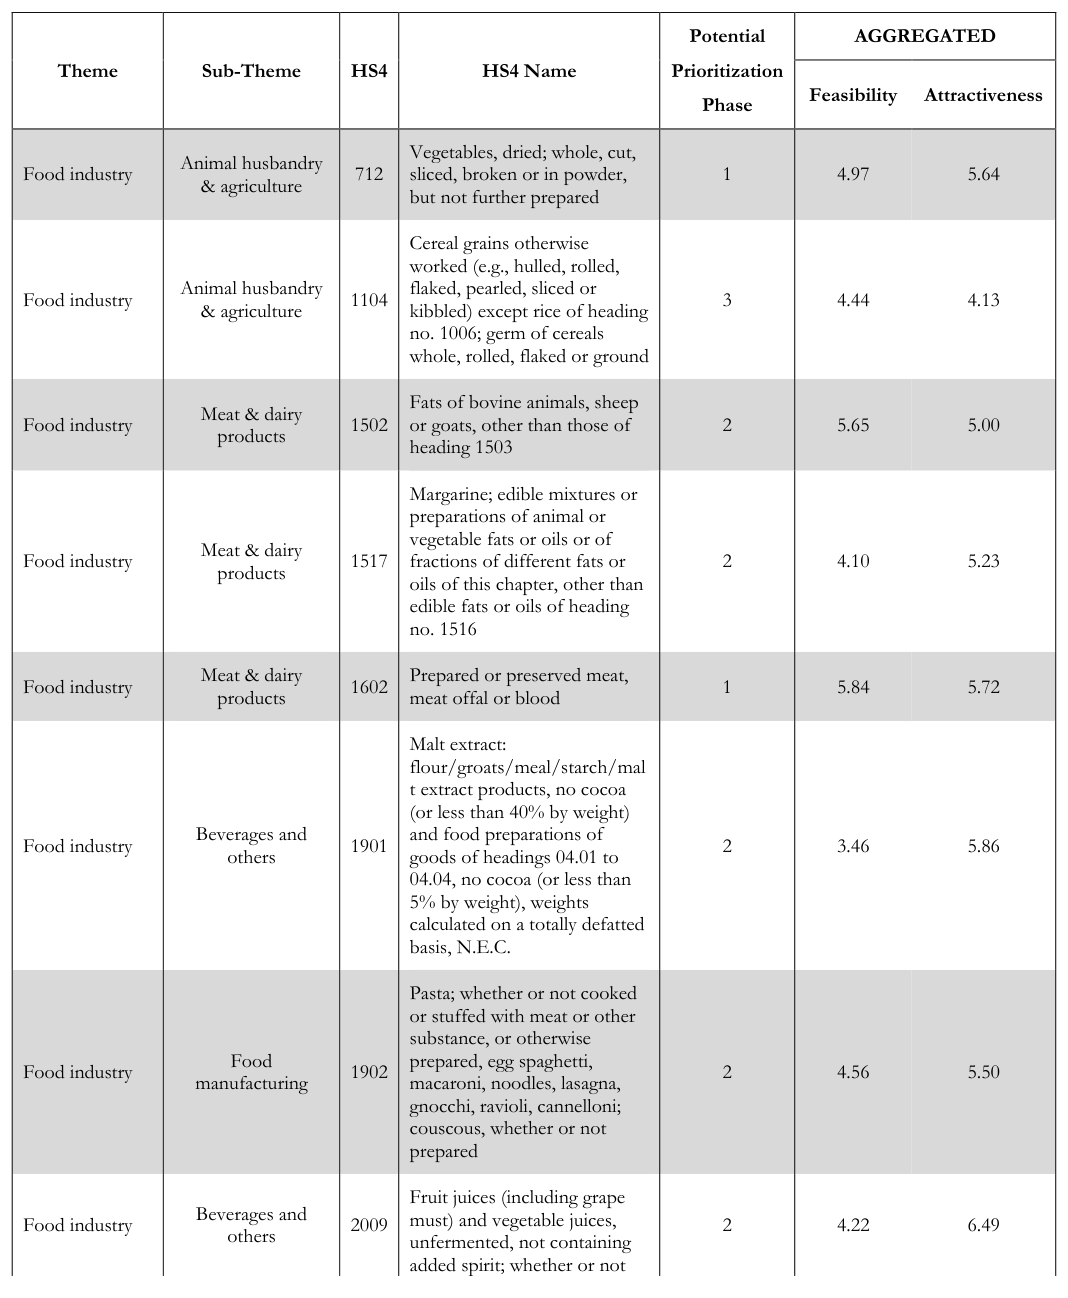
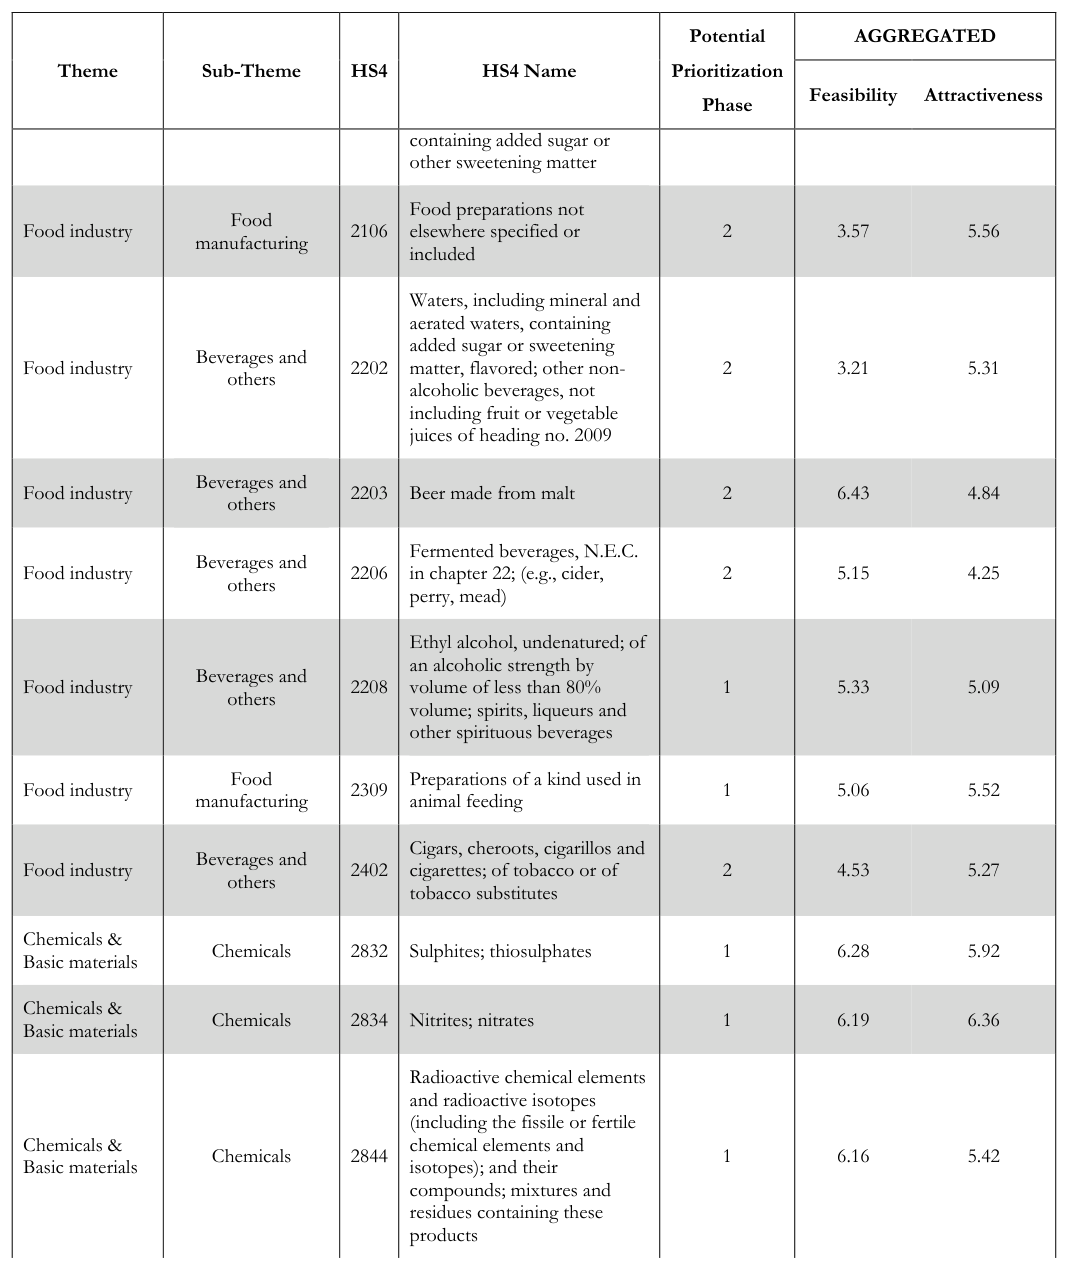
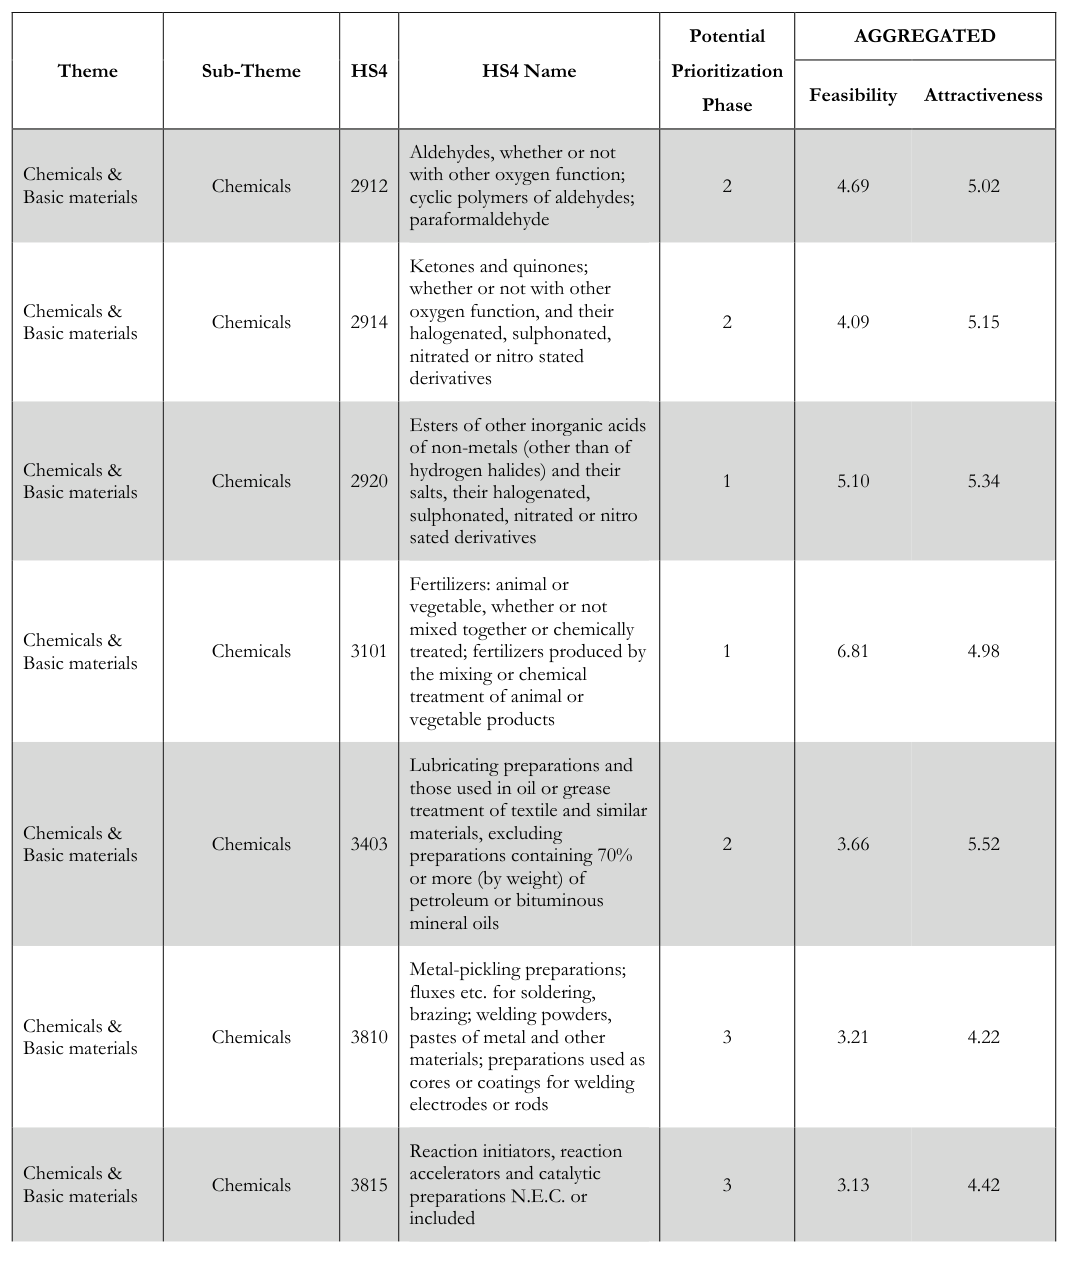
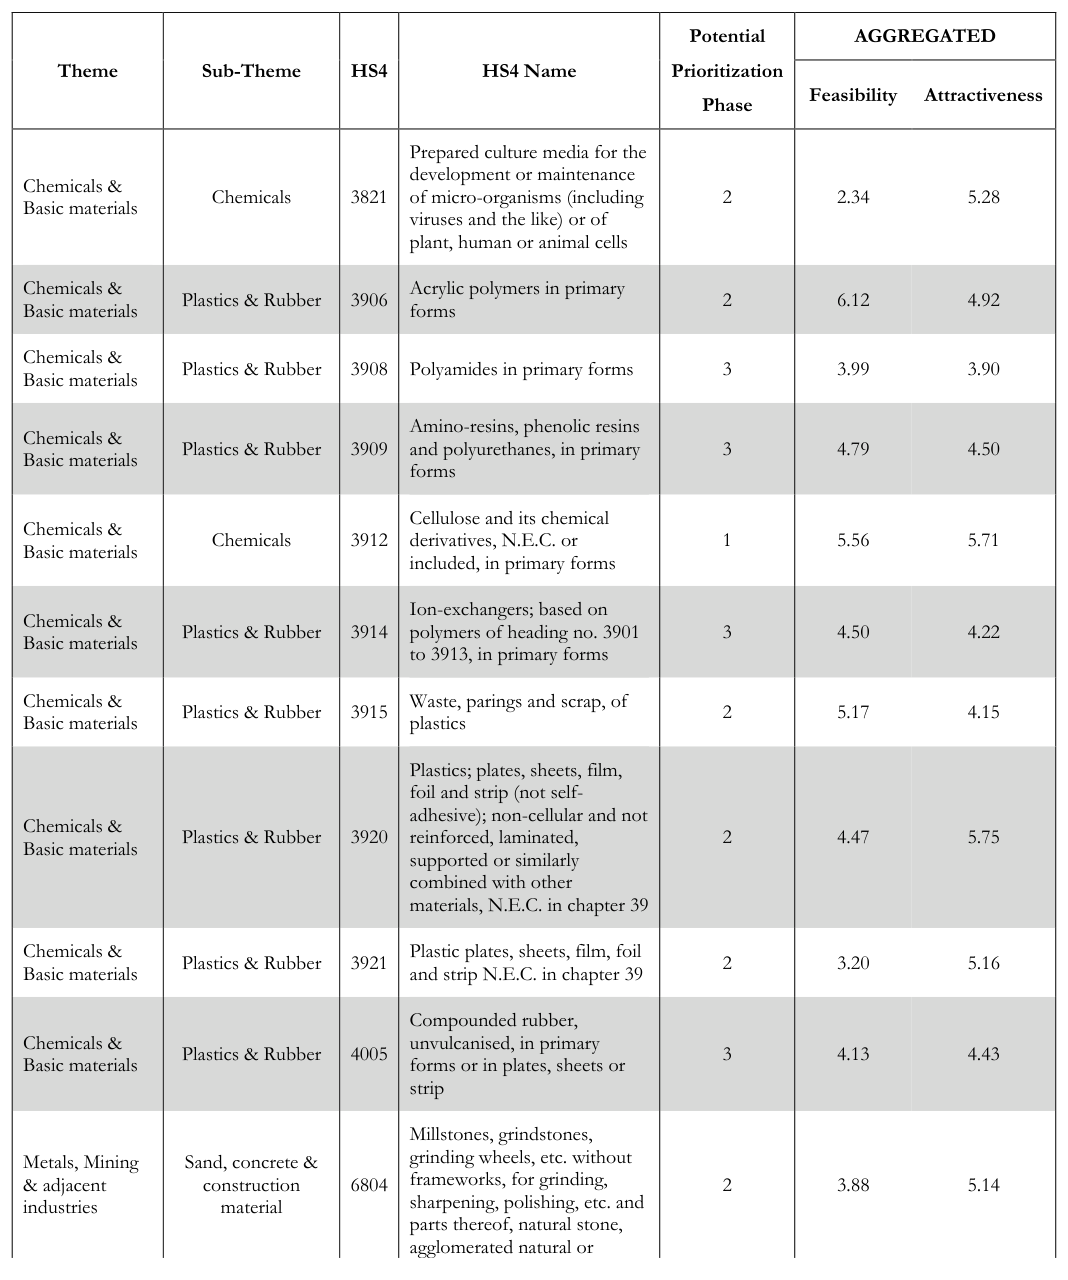
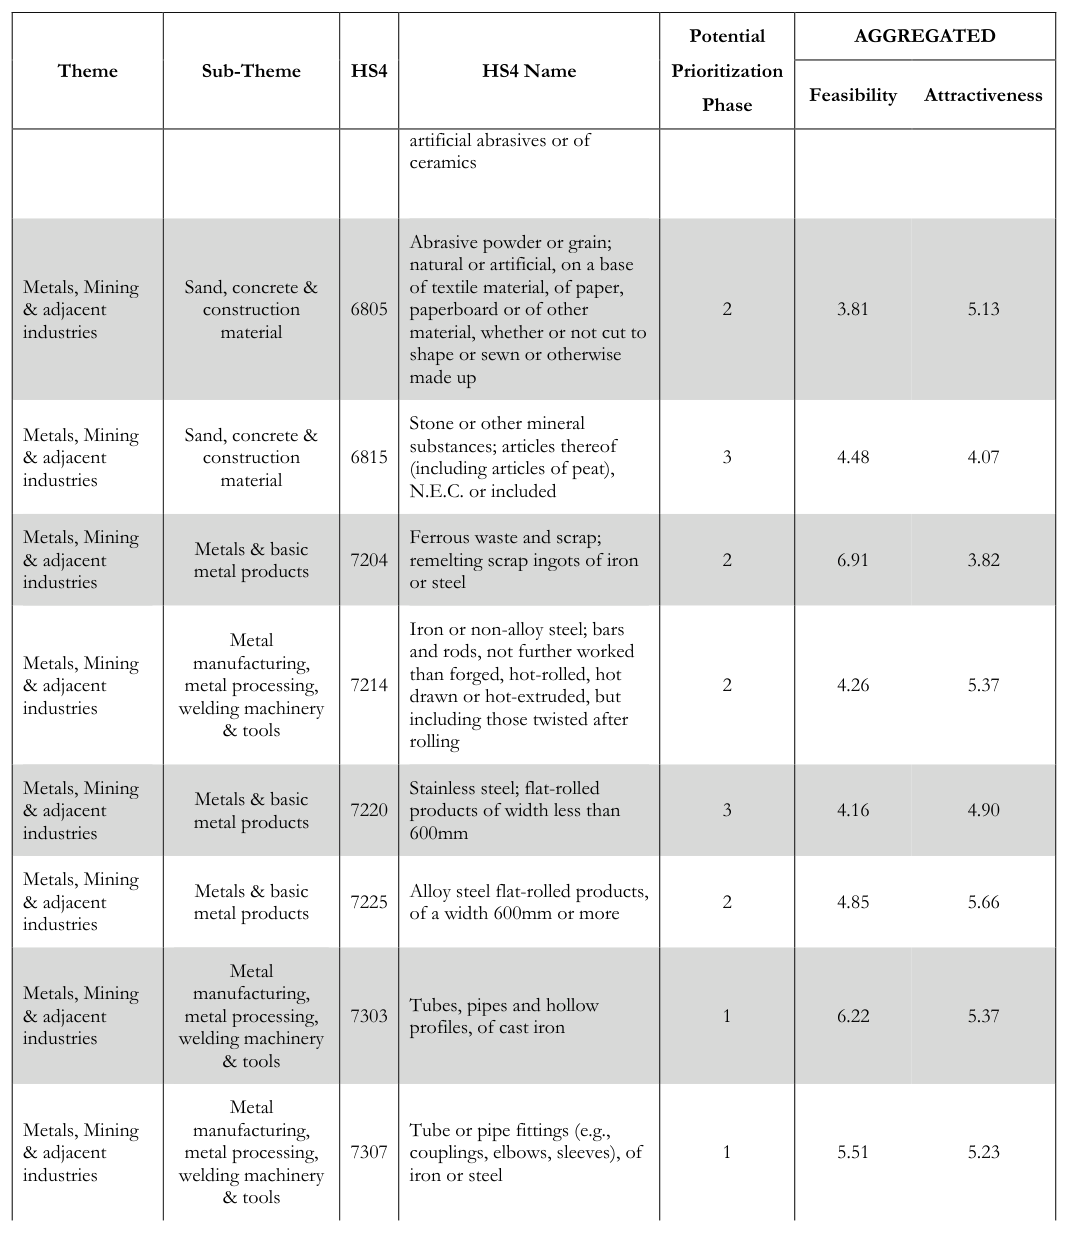
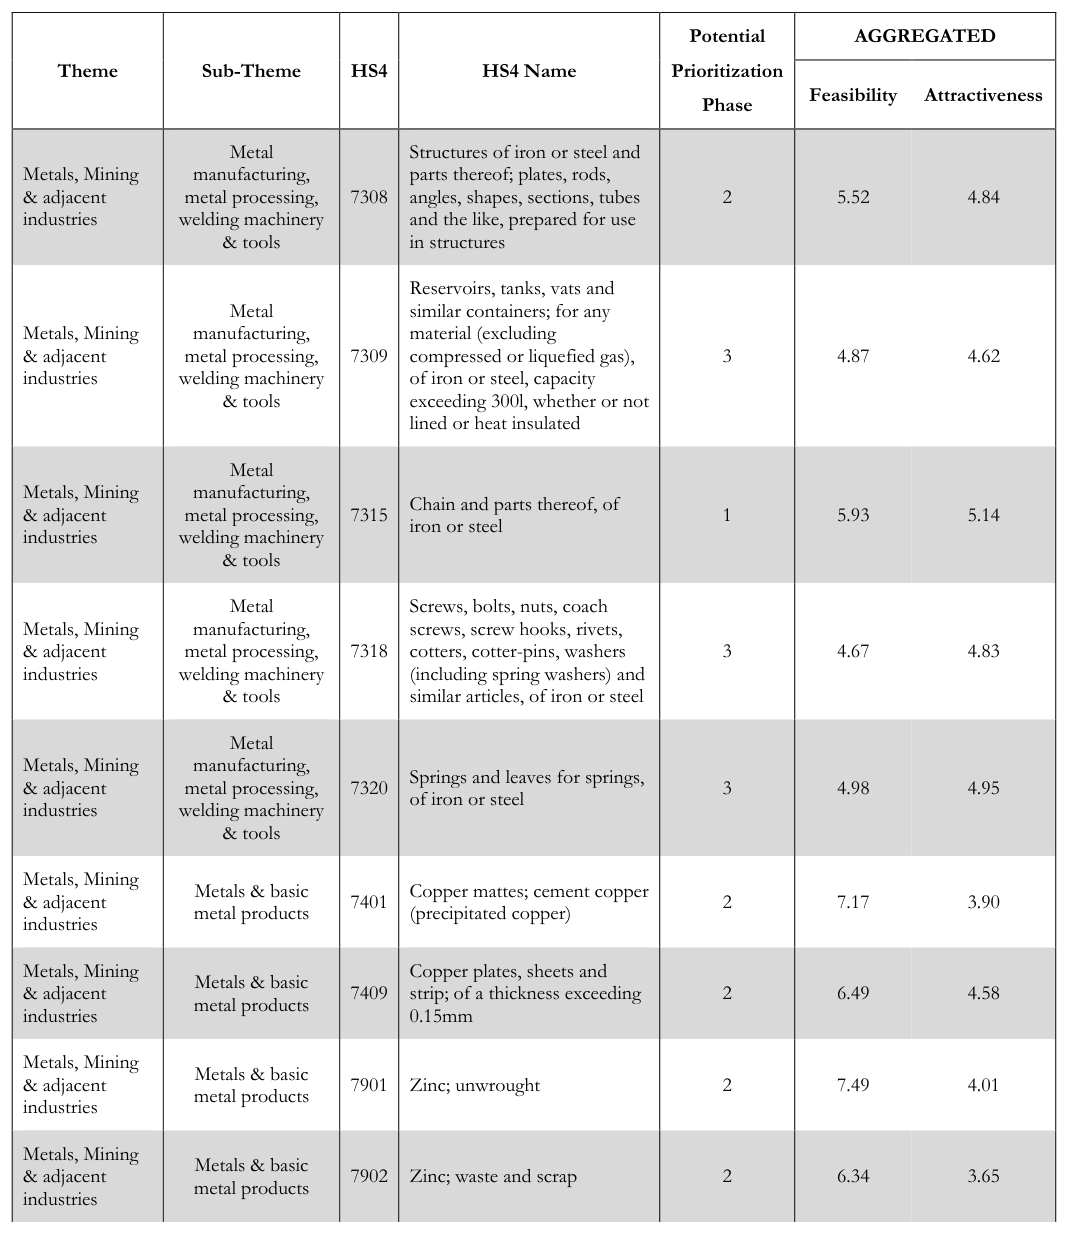
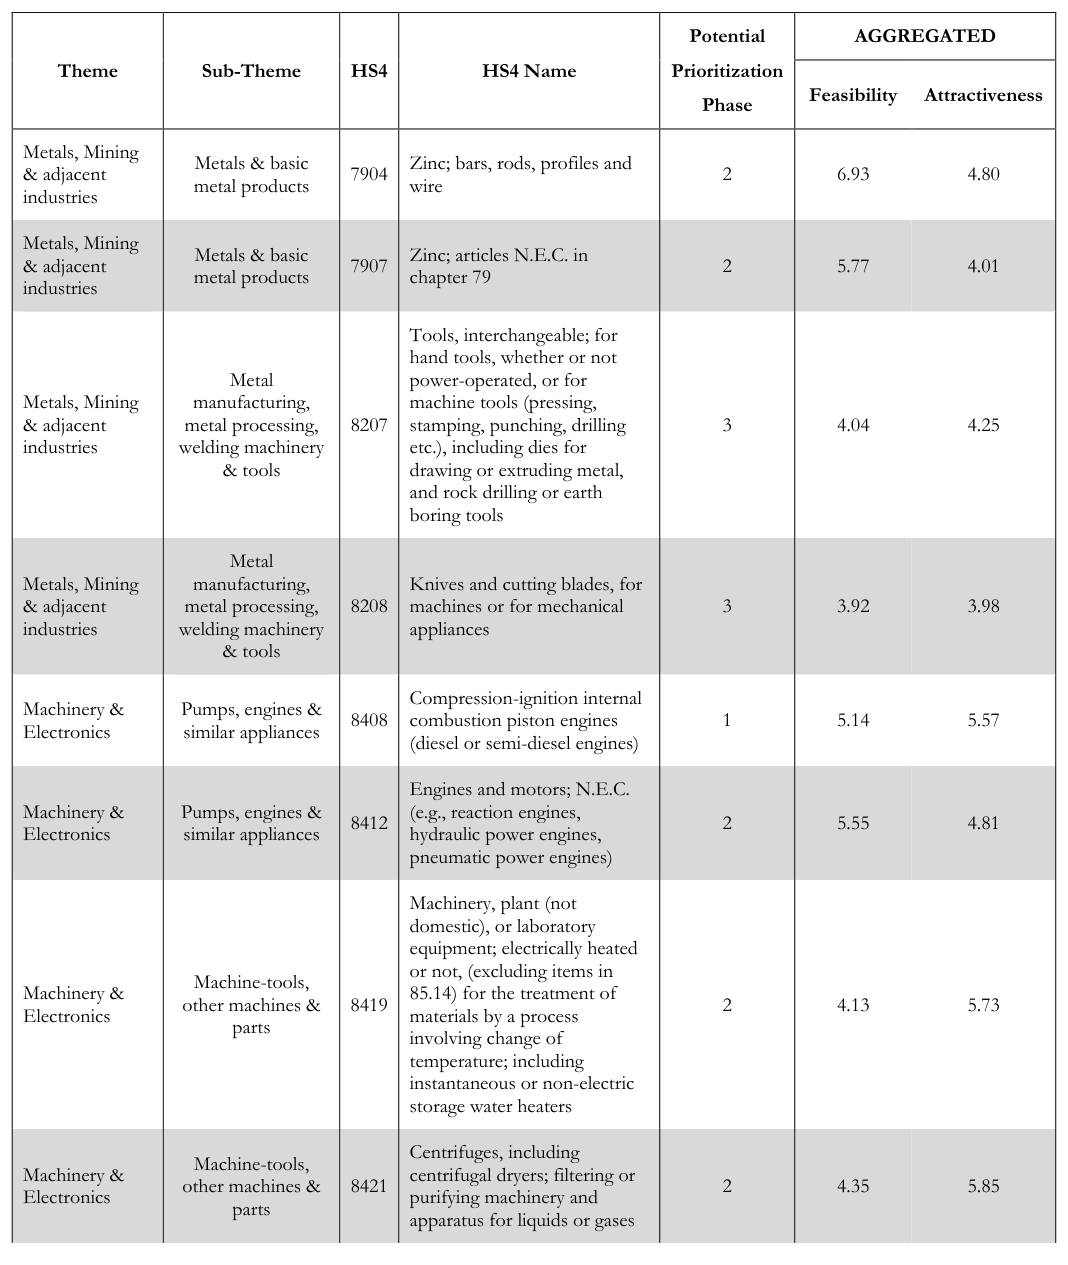
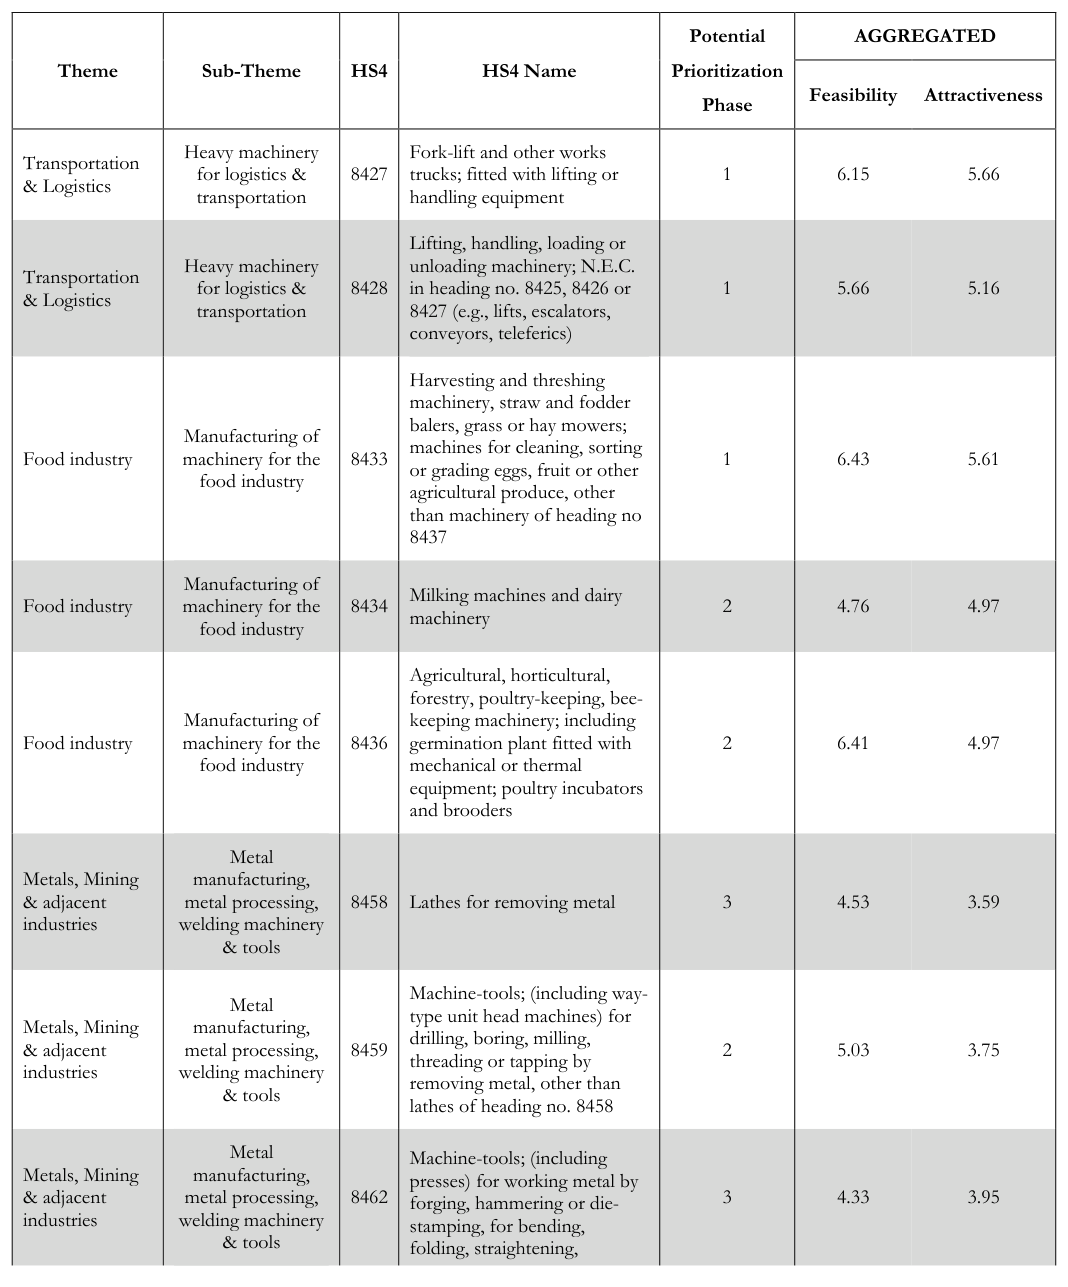
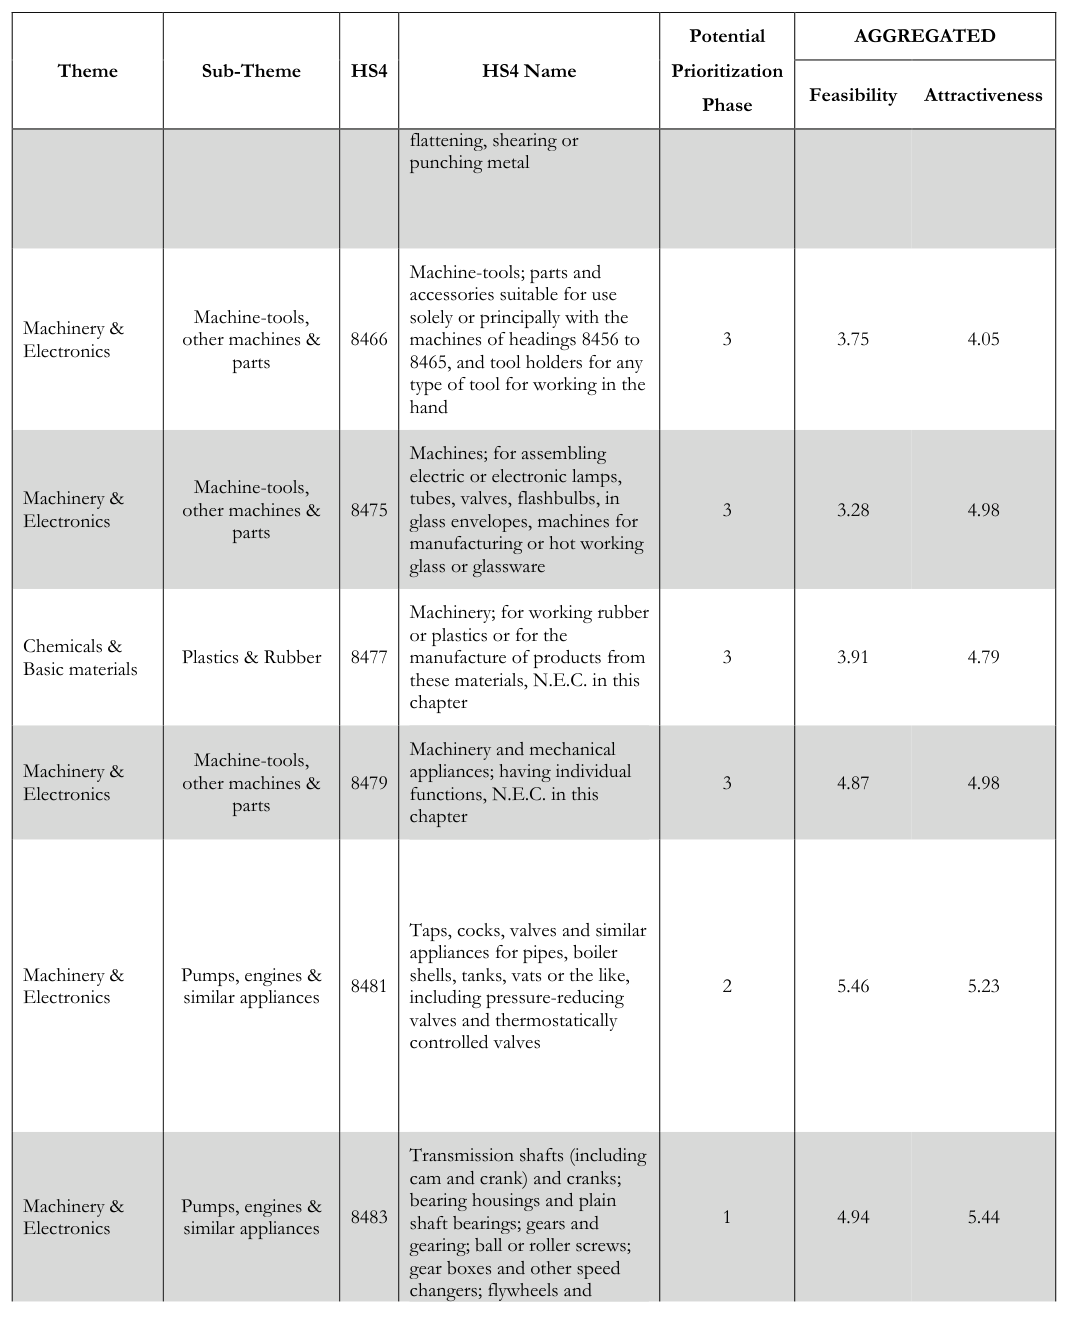
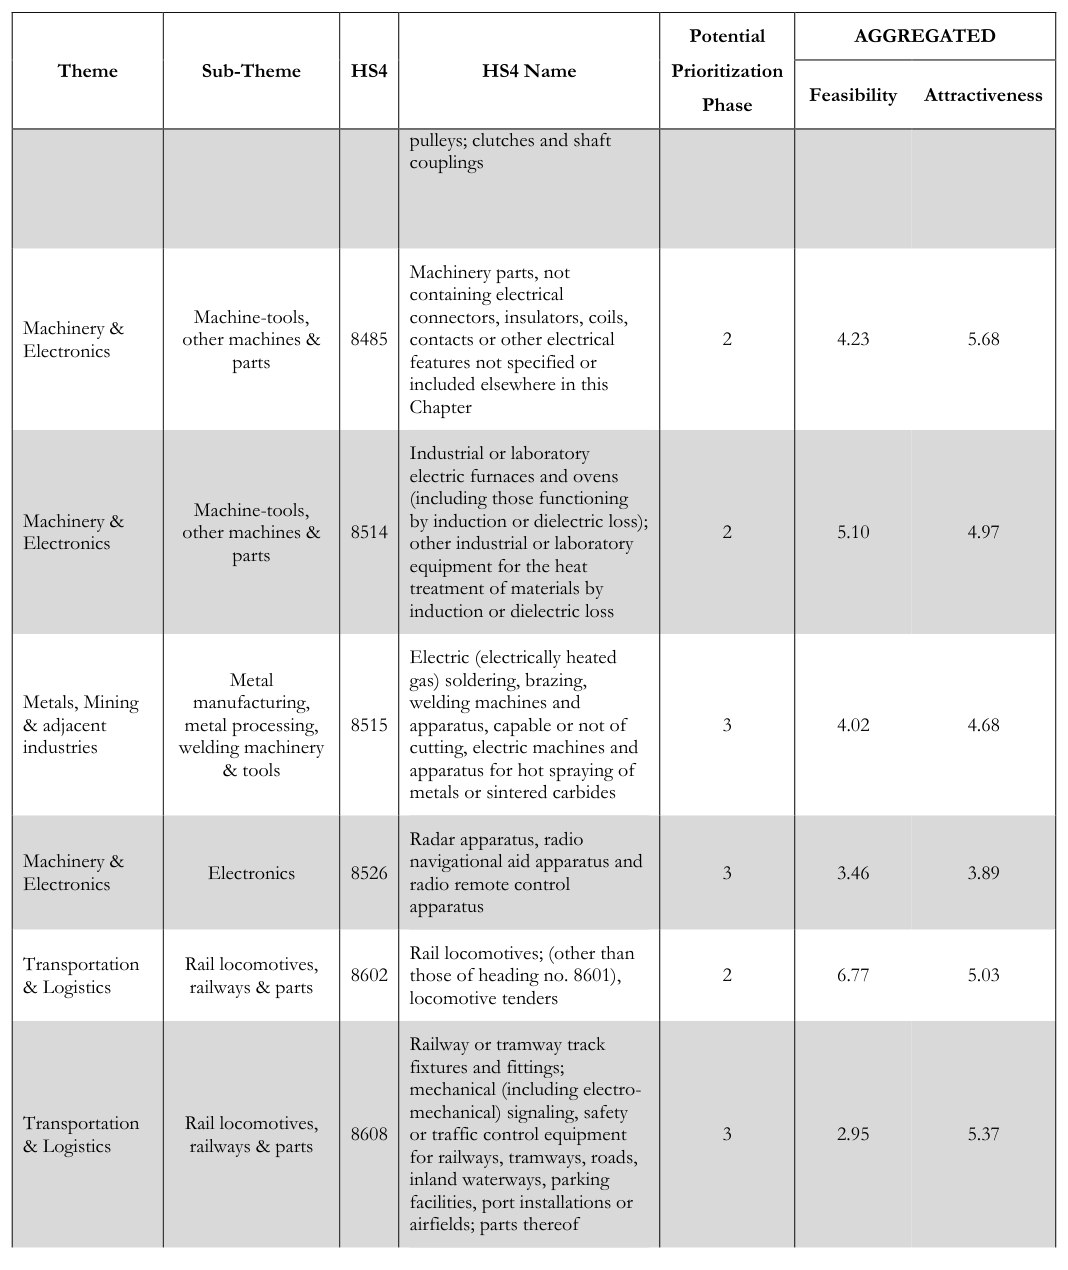
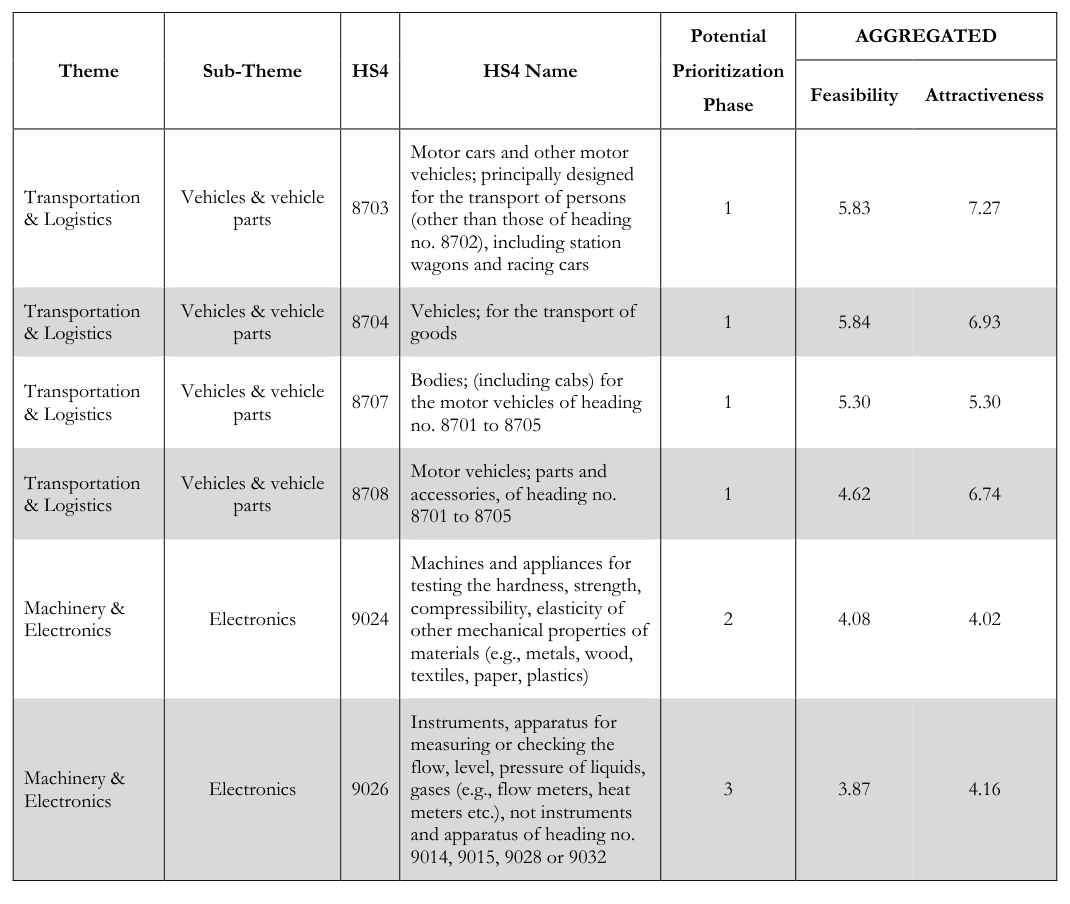
For each of the 97 products, the feasibility factors and the attractiveness factors were averaged into a single score. The summary scores for each product can be found in Annex 4.
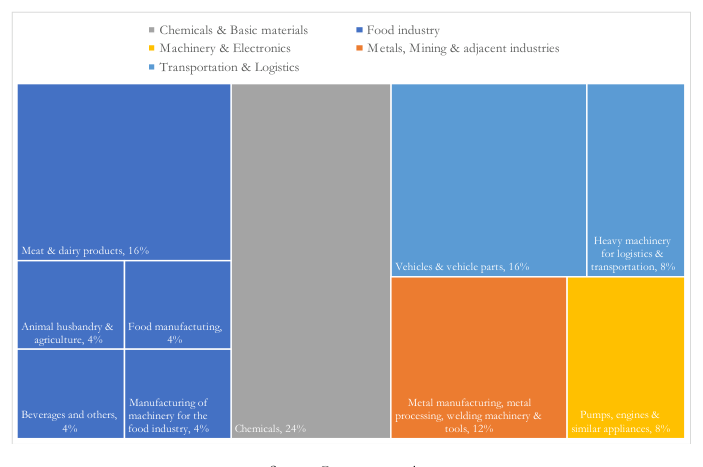
The scatterplot below (Figure 17) locates each product in the attractiveness-feasibility space based on its final, aggregated scores. The red products are the products with the highest feasibility and attractiveness, relative to the median 25 of all products. These should be the set of products that the country may want to prioritize. The orange and blue products have less compelling attractivenessfeasibility tradeoffs, they perform below the median in one of these categories. These products may be less of a priority for immediate action.
26 | Economic complexity report: A roadmap for productive diversification in Namibia
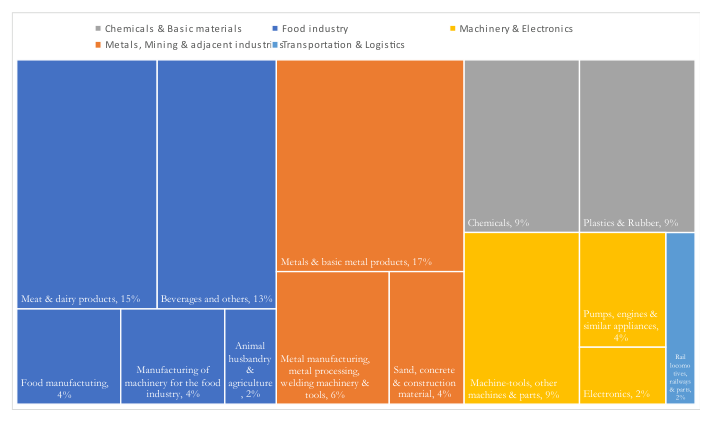
Lastly, the gray products represent products that fall below the median for both criteria, and hence the country may not want to prioritize them soon – yet continue to consider. For illustrative purposes we call the products in red as part of a potential Phase I (25 products), the products in orange and blue as part of a potential Phase II (47 products), and the ones in gray as part of a potential Phase III (25 products). Figure 18 and Figure 19 highlight the relative presence of each diversification theme and sub-theme for potential Phases I and II.
To make our findings more readily accessible and actionable for policymakers, we created an online tool with viability and attractiveness scores and their corresponding prioritization phase; not only for the 97 selected products but for all the product codes that exist. The tool also contains other relevant information at the product level, including sources of demand in the region; occupations demanded by product and an indicator of relative availability of the occupation in Namibia; wage distribution on the industry manufacturing the product versus the average; and the ten products that are more proximate to each product from a technological standpoint and an indicator of whether Namibia already has RCA>1 on them or not. 26
Figure 17. Potential Prioritization Matrix of Identified Products (Illustrative)
27 | Economic complexity report: A roadmap for productive diversification in Namibia
Figure 18. Treemap of Diversification Themes and Sub-Themes in Preliminary Phase I
28 | Economic complexity report: A roadmap for productive diversification in Namibia
5.5 Contrast between Economic Complexity and a Beneficiation Approach to diversification
Figure 20. Top 50 Industries by Strength of Forward Linkage: A Beneficiation Strategy
29 | Economic complexity report: A roadmap for productive diversification in Namibia
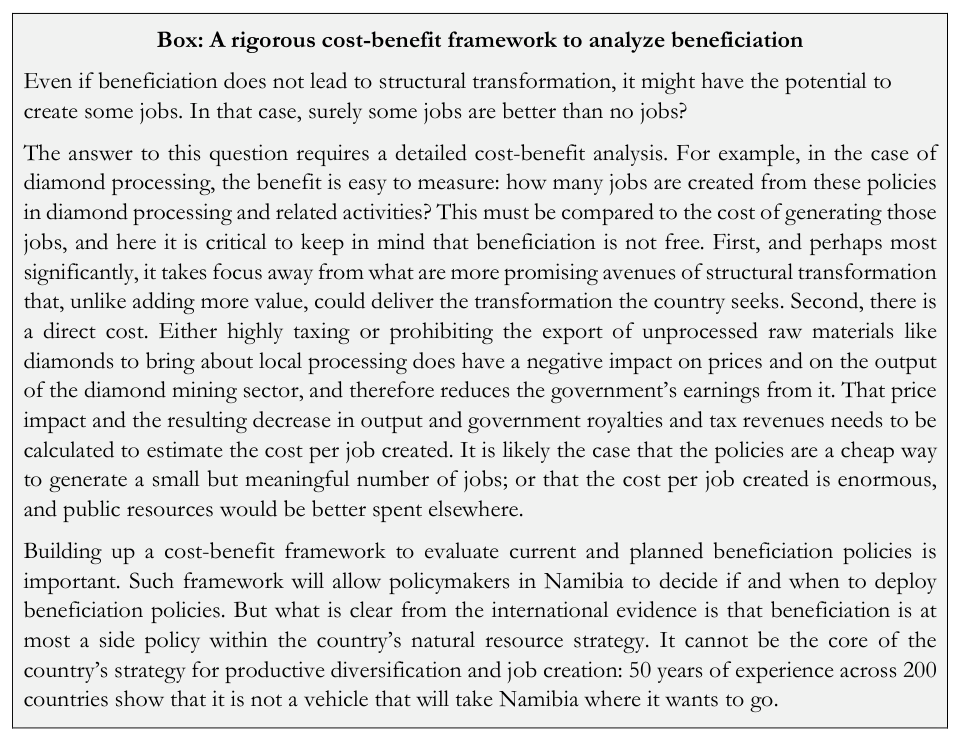
That is not to say that attractive value-adding activities should be ignored entirely. For example, there are some products in the plastics and rubbers product group that are both directly downstream and arise in the parsimonious strategy above (deliver the largest product complexity by unit of distance). The difference lies in the fact that these opportunities should arise naturally within a broader framework for accelerating structural transformation that considers all potential sectors. Looking down value chains would preclude the identification and development of diversification opportunities that requires less efforts, add more value, and can potentially connect with other complex sectors. It would also distract from policy efforts that could otherwise achieve broader structural transformation and divert policy resources and attention away from where they are needed most.
6. Concluding Remarks and Policy Implications
We have explored the productive structure of the economy of Namibia and identified an initial list of promising opportunities for economic diversification. The basis of the analysis presented in this report arises from data on net exports at the four-digit level from UNCOMTRADE. This allows a descriptive understanding of Namibia’s position in the Product Space as well as the opportunities for gains in economic complexity.
30 | Economic complexity report: A roadmap for productive diversification in Namibia
Namibia’s exports over the previous two decades display low relative diversity and ubiquity, which is consistent with a relatively low Economic Complexity Index. This is consistent with an export basket dominated by agricultural and mineral goods – goods of relatively low Product Complexity Index. Namibia’s differential success in developing adjacent products illustrates the potential to successfully diversify into opportunities that leverage its existing capabilities. Taken together, it is not so much that Namibia cannot diversify, but rather that opportunities available to Namibia have low complexity and low strategic value. Keeping in mind that the path to productive diversification and ultimately structural transformation in Namibia might be steeper than for most peers, this necessarily calls for an active policy stance that balances the goal of progressive accumulation of capabilities, coordinated “long jumps,” and stronger state capacity to support and internalize the externalities of self-discovery.
Following a sector identification process that considers both opportunities in the intensive margin and the extensive margin a total of 97 potential products were identified. These in turn were grouped in five preliminary diversification themes that include: (i) Chemicals & Basic materials, (ii) Food industry, (iii) Machinery & electronics, (iv) Metals, mining, & adjacent industries, and (v) Transportation & logistics. The industries identified in each of these broad diversification themes are further listed out and are indicative of the inherently capabilities that Namibia currently has, and it is not necessarily a laundry list of precise recommendations to pursue doggedly and narrowly.
The report also introduces data on several relevant feasibility (exiting presence, implied access to inputs, intensiveness in the use of scarce factors, intensiveness in the use of strategic factors, propensity to thrive in places with low population agglomeration) and attractiveness factors (export propensity, propensity to attract FDI, likelihood of employing groups of interest, independence to demand shocks faced by relevant commodities, scope for regional demand factors) for each of the promising industry opportunities. Based on the relative performance on each metric, the specific challenges and opportunities associated with each diversification opportunity may be teased out further. Additionally, this information could be leveraged to prioritize diversification efforts. The report highlights an exercise of this nature, allocating products to potential Phases I, II or III.
We have contrasted the outputs of a diversification strategy based on knowhow and the tenets of Economic Complexity with the beneficiation approached that has predominated in Namibia’s industrial policy efforts. Our results suggest that a beneficiation approach is likely suboptimal, as it will force the government to focus on industries for which a larger number of inputs is missing, which at the same time have a lower dividend in terms of Economic Complexity and strategic value.
We aim to provide complementary information that government officials and other stakeholders can use to help strategize how to better catalyze diversification in the country. The information is intended to be used in combination with other quantitative analyses of diversification opportunities and context-specific knowledge of institutions and local constraints.
Conventional efforts to formulate “vertical” policies – that is, policies that target specific sectors – have on the one hand been behind the most successful structural transformations and on the other hand are also the cause of disappointing policy failures. Across global experiences, the significant variation observed in policy impact seems to be driven essentially by two sets of factors. First, some countries have used vertical policies to respond to political pressures from certain sectors and interest groups, as opposed to fostering the ones that are most likely to develop in an organic and competitive 31 | Economic complexity report: A roadmap for productive diversification in Namibia
way. Second, even if well-intentioned, selecting the right sectors to target is technically difficult, as it involves processing large amounts of information and gathering inputs from multiple stakeholders with differing perspectives. 28 The analysis presented here encompasses a certain set of assumptions and understanding of international trade data, and supplemental qualitative interviews with entities across various sectors enriched the sector selection process. Ultimately, work comprised in this paper follows two of the essential tenets of a sound selection process – objective analysis of the relevant data available, and parallel independent assessment – but it should nonetheless be considered as a roadmap, as opposed to a definitive list.
Following an iterative and collaborative process of validating and updating the sectors identified, efforts to then promote high-potential sectors should focus on identifying the factors that are preventing these opportunities from materializing spontaneously. Thereafter, designing policy interventions that aim to sort or alleviate them are essential to unlocking the obstacles to new sectors taking off. The institutional devices required to identify sector-specific constraints and then to mobilize the relevant private sector stakeholders around a solution varies with the relative intensity or presence of these sectors in Namibia. In some cases, there are well-establish firms that have pertinent stakeholders in the country, whereas in other cases where industries are absent, it takes an effort to reach out to international players. Policy goals of investment promotion and export development must work in tandem with existing and new players within each target sector.
As stakeholders incorporate the results of this paper into their strategy, policy, and public investment decisions, it will be critical to focus less on precisely what industries are identified and where, and more on how to catalyze the emergence of these opportunities across Namibia as a whole. The process of diversification happens through businesses exploring how they can expand on products that they make and services that they provide in a place and, often, through businesses in one place determining that they can do what they currently do in a new place. In both cases, the process involves businesses and entrepreneurs discovering opportunities and taking risks. This paper aims to enhance the roles that the country can play in supporting discovery, lowering risks, and providing public goods that the private sector needs to succeed in new business activities.
As noted in several sections of this report, the objective of this exercise was to leverage the information associated with Namibia’s latent productive capabilities as a country. In this regard, our research effort has two limitations that could be potentially addressed by future research: It has been made at the national level (and does not associate the industries with potential to specific regions within Namibia) and has only been made at the goods level (does not include services).
A national-level strategy presents chances for scale and policy coherence to spur investment and unlock diversification opportunities; however, a regional focus might allow to circumvent access more easily certain types of inputs and may be required to pursue certain policy objectives around growth and inclusion. Evidence from other contexts and in the literature supports the prevalence of relationship between growth and complexity at the subnational level – the trends hold at the state, city, and municipality level.
32 | Economic complexity report: A roadmap for productive diversification in Namibia
Given the limited access to representative internationally standardized data on services and the consequent focus of this report on identifying diversification opportunities based on goods exports, future iterations of this work could leverage new datasets and methodological approaches that can include services industries into the analysis and yield a preliminary list of diversification opportunities of tradable services. Services tend to be highly specialized activities and require different types of knowhow to come together. Therefore, the most promising scope of this effort might be to focus on diversification opportunities in the service sector for the largest urban agglomerations in the country.
33 | Economic complexity report: A roadmap for productive diversification in Namibia
References
Hausmann, R. (2016). Economic Development and the Accumulation of Knowhow. Welsh Economic Review, N.- 24, pp. 13-16.
Hausmann, R., et al. The atlas of economic complexity: Mapping paths to prosperity. MIT Press, 2014.
Hausmann, R., O’Brien, T., Santos, M.A., Grisanti, A., Kasoolu, S., Taniparti, N., Tapia, J. and Ricardo Villasmil (2019). Jordan: The elements of a growth strategy. Harvard CID Faculty Working Paper Series No. 346.
Hausmann, R., Santos, M.A., Barrios, D., Muhaj, D., Noor, S., Pan, C., and Jorge Tapia (2020). Emerging Cities as Independent Engines of Growth: The Case of Buenos Aires. Harvard Center for International Development Faculty Working Paper No. 385.
Hausmann, R., Santos, M.A., Tudela, J., Li, Y., and Ana Grisanti (2020). The hidden wealth of Loreto: Economic complexity analysis and productive diversification opportunities Harvard Center for International Development Faculty Working Paper No. 386.
Hausmann, R., et al. Economic Complexity Report for Western Australia. No. 394. Center for International Development at Harvard University, 2021.
Hausmann, R., Santos, M.A., Barrios, D., Muci, F., Taniparti, N. Tudela, J. (2021). A Growth Diagnostic of Namibia. Harvard CID Faculty Working Paper Series No. 405.
Hausmann, R. and Klinger, B., (2006). Structural Transformation and Patterns of Comparative Advantage in the Product Space.

Hidalgo, C. and Hausmann, R. (2009). The Building Blocks of Economic Complexity. Proceedings of the National Academy of Sciences of the United States of America. 106, pp10570-10575.
34 | Economic complexity report: A roadmap for productive diversification in Namibia
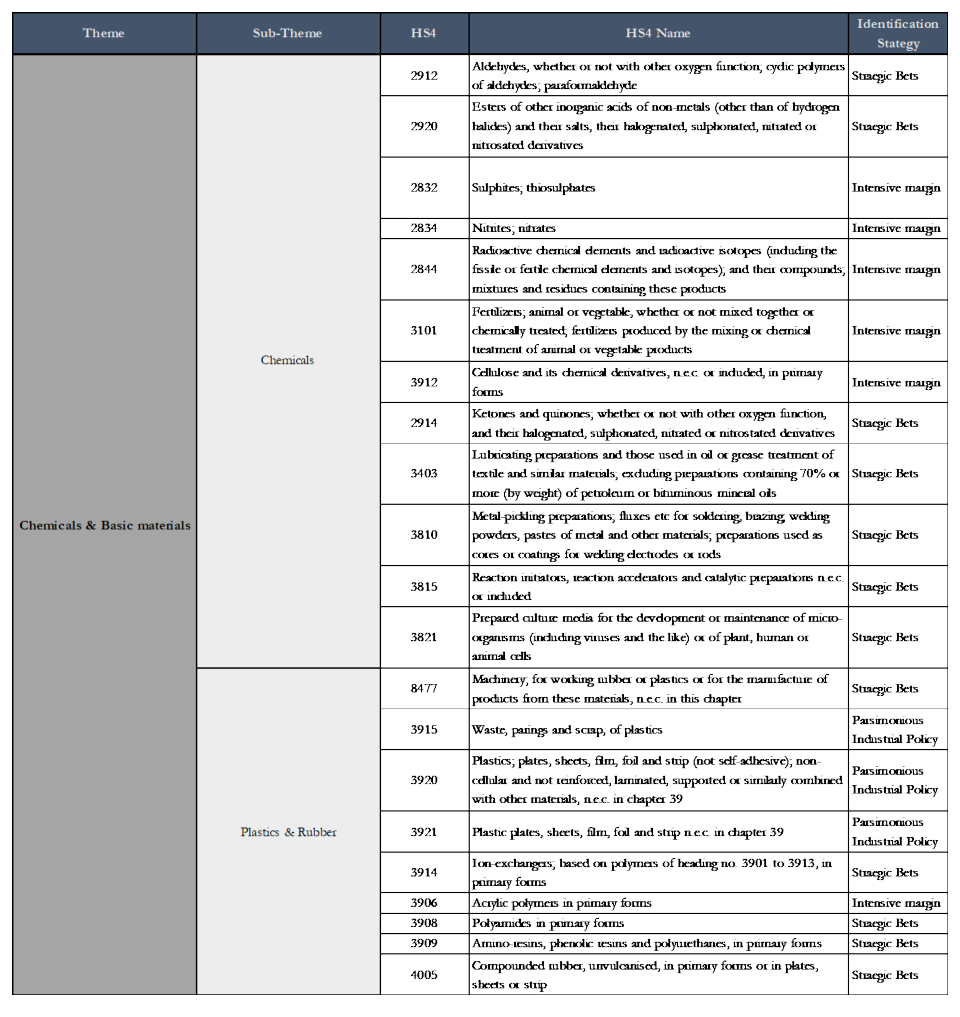
Annex 1: Diversification themes, sub-themes and preliminarily identified industries
35 | Economic complexity report: A roadmap for productive diversification in Namibia
36 | Economic complexity report: A roadmap for productive diversification in Namibia
37 | Economic complexity report: A roadmap for productive diversification in Namibia
38 | Economic complexity report: A roadmap for productive diversification in Namibia
Annex 2: Performance in feasibility factors
39 | Economic complexity report: A roadmap for productive diversification in Namibia
40 | Economic complexity report: A roadmap for productive diversification in Namibia
41 | Economic complexity report: A roadmap for productive diversification in Namibia
42 | Economic complexity report: A roadmap for productive diversification in Namibia
43 | Economic complexity report: A roadmap for productive diversification in Namibia
44 | Economic complexity report: A roadmap for productive diversification in Namibia
45 | Economic complexity report: A roadmap for productive diversification in Namibia
46 | Economic complexity report: A roadmap for productive diversification in Namibia
47 | Economic complexity report: A roadmap for productive diversification in Namibia
Annex 3: Performance in attractiveness factors
48 | Economic complexity report: A roadmap for productive diversification in Namibia
49 | Economic complexity report: A roadmap for productive diversification in Namibia
50 | Economic complexity report: A roadmap for productive diversification in Namibia
51 | Economic complexity report: A roadmap for productive diversification in Namibia
52 | Economic complexity report: A roadmap for productive diversification in Namibia
53 | Economic complexity report: A roadmap for productive diversification in Namibia
54 | Economic complexity report: A roadmap for productive diversification in Namibia
55 | Economic complexity report: A roadmap for productive diversification in Namibia
56 | Economic complexity report: A roadmap for productive diversification in Namibia
57 | Economic complexity report: A roadmap for productive diversification in Namibia
Annex 4: Inputs for potential prioritization: Average feasibility/attractiveness performance
58 | Economic complexity report: A roadmap for productive diversification in Namibia
59 | Economic complexity report: A roadmap for productive diversification in Namibia
60 | Economic complexity report: A roadmap for productive diversification in Namibia
61 | Economic complexity report: A roadmap for productive diversification in Namibia
62 | Economic complexity report: A roadmap for productive diversification in Namibia
63 | Economic complexity report: A roadmap for productive diversification in Namibia
64 | Economic complexity report: A roadmap for productive diversification in Namibia
65 | Economic complexity report: A roadmap for productive diversification in Namibia
66 | Economic complexity report: A roadmap for productive diversification in Namibia
67 | Economic complexity report: A roadmap for productive diversification in Namibia
68 | Economic complexity report: A roadmap for productive diversification in Namibia
69 | Economic complexity report: A roadmap for productive diversification in Namibia
Annex 5: Methodology for assessing access to occupations One of the key determinants of the development of any productive activity in a certain location is the availability of workers that can fill key occupations that are required in that industry. Therefore, determining the availability of the right occupations in a certain location is critical to determining whether that industry may be viable in that location. In view of its relevance, the Growth Lab developed a methodology to measure implicitly whether an occupation may be available or not in a certain location, based on information from the USA Bureau of Labor Statistics on occupational vectors needed per industry. As noted earlier in the report, using data from the USA economy is useful not only because the country has accessible and reliable databases but because it also displays an advanced productive structure and a wide collection of industries, which can provide a good approximation of how individual industries would interact with each other if and when they are fully developed in Namibia.
The main idea of this methodology is the assumption that an occupation is available in a certain location if there are other industries that already exist in that location that also require the occupation in an important way. The methodology first identifies which occupations are demanded more importantly by the industries of interest comparatively to other occupations. To this end, an RCA in the demand of a certain occupation is calculated for every industry. This indicator is analogous to the one used to measure the intensity to which an industry is developed in the country. The calculation is as follows: the percentage of the total employment in a particular occupation for a certain industry, is divided by the percentage of the total employment in that occupation for the entire economy. If this RCA is equal or greater than one, the occupation is demanded “intensively” by the industry in question, relative to the rest of the economy. Next, to assess whether the occupations intensively required by the diversification opportunities identified are available in Namibia, we count the number of industries that intensively demand the same occupation and have already been identified as present in the country (according to RCA). If a sufficiently large number (4 or more 29 ) of industries meet this criterion, then the occupation is also considered to be available. In short, the methodology presumes that an occupation is available in Namibia if a sufficiently large number of industries that intensively demand it are intensively present in Namibia.
The result of this exercise is a list of the occupations that are intensively demanded by each diversification opportunity, which can be classified either as available or missing. Performance on this factor is measured by the share of occupations that are intensively required by the industry in question and that are considered to be accessible in Namibia.
70 | Economic complexity report: A roadmap for productive diversification in Namibia
Annex 6: Methodology for assessing access to required inputs An important element for the development of any productive activity is firms’ capacity to access the intermediate inputs required in the production process, which are usually supplied by third parties, whether domestic or imported. The ability to access intermediate inputs in a given location is critical to determine the viability of an industry. It is important to note that for an intermediate input to be available in a particular location, it is not necessary that the industries that offer the input exist in the same location, as it is sufficient that the input is accessible through imports (to the extent that the input is tradable). In view of its relevance, the Growth Lab developed a methodology to implicitly measure a particular country’s performance on this factor, based on information from USA Input- Output tables. As noted in the report, using data from the USA economy is useful not only because the country has accessible and reliable databases but because it also displays an advanced productive structure and a wide collection of industries, which can provide a good approximation of how individual industries would interact with each other if and when they are fully developed in Namibia.
The methodology first identifies which goods and services are intensively required by the industries of interest. To this end, an RCA in the use of the different inputs (RCAI) is calculated for every industry. This indicator is analogous to the one used to measure the intensity to which an industry is developed in the country. In the case of the RCAI, the calculation is as follows: the percentage of the total demand for inputs of the specific industry that is given by a particular input is divided by the percentage of the total demand for inputs in the economy that is given by that same input. If the RCAI is equal or greater than one, the input is demanded intensively by the industry in question, relative to the rest of the economy. Next, to assess whether the inputs intensively required by the diversification opportunities identified are available in Namibia, a combination of two tests are applied. The first test evaluates if the input, an industry in itself, is present in the country. For this, the traditional RCA measure is used. If the industry shows an RCA equal or greater than one, then the input that it offers is considered to be available. If this is not the case, the second test evaluates if other industries that intensively demand the same input are present in the country (using RCA). If a sufficiently large number (4 or more 30 ) of industries meet this criterion, then the input is also considered to be available. In short, the methodology presumes that an input is available in Namibia if it comes from an industry that is intensively present in Namibia or if a sufficiently large number of industries that intensively demand it are intensively present in Namibia.
The result of this exercise is a list of the intermediate inputs that are intensively demanded by each diversification opportunity, which can be classified either as available or missing. Performance on this factor is measured by the share of inputs that are intensively required by the industry in question and that are considered to be accessible in Namibia.
71 | Economic complexity report: A roadmap for productive diversification in Namibia
Annex 7: Methodology for assessing exposure to exogenous shocks to Namibian exports Minerals account for 50-60% of Namibia’s exports, around 10% of GDP, 6% of tax revenue, which implies that the Namibian economy faces significant downside risks to adverse exogenous shocks to the demand for its main commodities. In that regard, it may be beneficial that potential diversification opportunities display demand matters that are somewhat independent from its main commodities as to introduce additional resiliency to its economic activity.
To assess how the demand for HS4 products relate (or not) to the demand for Namibia’s main commodities, we estimated the extent to which gross world exports of HS4 products are linked with a price index of relevant commodities. This involved four steps. First, we constructed a metals and mining price index for Namibia using commodity prices from the IMF and other sources weighted by current export basket shares. Second, we calculated gross world exports at the HS4 level with data from the Atlas of Economic Complexity. Third, we estimated the correlation between % change of the index and the % change in gross world exports at the HS4 level. Lastly, we regressed the % change of the index on the % change in gross world exports at the HS4 level. The regression is given by

where tt indicates the time period, ii indicates the HS4 product, ββ ii are the coefficients of interest, and αα ii is are constant terms.
As a sense check of the results of the exercise, the 257 HS4 coefficients in the HS2 categories we classified as being linked to metals and mining 31 had an average beta of 1.40, meaning that each percentage point increase in Namibia’s commodity price index is associated with a 1.40 percentage point increase in those exports. Meanwhile, the remaining 963 HS4 products not associated with metals and mining have an average beta of 0.69, indicating that a percentage point increase in Namibia’s commodity index is associated with a 0.69 increase in gross world exports of that HS4 category. A minority of HS4 codes had negative coefficients, meaning that gross exports of those products tend to rise as Namibia’s commodity prices fall. HS4 codes that showed a non-significant beta were assigned a beta of 0 (as we failed to reject the null hypothesis that the beta is 0). To deal with a handful of outliers, we replaced betas greater than 3 and less than -3 with 3 and -3, respectively.
In order to inform the attractiveness factor both the betas and the correlations calculated in step 3 were normalized and averaged as described previously in the report.
72 | Economic complexity report: A roadmap for productive diversification in Namibia