Transcripción completa del PDF reformateada para lectura web. Descargar PDF original para tablas, figuras y referencias.
JBR-07880; No of Pages 8 Contents lists available at SciVerse ScienceDirect
Víctor Contreras a , ⁎ , Urbi Garay a , b , 1 , Miguel Angel Santos a , 2 , Cosme Betancourt a , 2 a b s t r a c t a r t i c l e i n f o This paper examines the microeconomic determinants of residential real estate prices in Caracas, Venezuela, using a private database containing 17,526 transactions from 2008 to 2009. The particular institutional characteristics of many countries in Latin America, and Venezuela in particular, where land invasions and expropriations (with only partial compensation) have been common threats to property owners, provide us with an opportunity to test the effects of these risks on housing prices using a unique database. The effect of these risks on property prices is negative and signi fi cant. To our knowledge, this is the fi rst attempt to quantify these impacts in the Hedonic pricing literature applied to real estate. Size, the number of parking spaces, the age of the property, the incidence of crime, and the average income in the neighborhood are signi fi cant determinants of prices. Finally, this paper analyzes the microeconomic determinants of housing prices at the municipal level.
1. Introduction This article examines the microeconomic determinants of the price (per square meter) of housing in Caracas, Venezuela. By doing so, it builds a framework of reference for investors who can use it to determine the price of a property based on its attributes; for owners, who may apply it to determine the value of their properties and the characteristics that drive their values; to developers, as they can estimate the optimal combination of attributes a property should have in order to maximize their bene fi ts; to banks, who will have an objective methodology of valuation of assets that will serve as a guarantee for the delivery of a possible credit; and, fi nally, to policy makers, who can gauge, among other fi ndings, the negative impact that invasions and expropriations may have on property prices. This is the fi rst study of this type performed in Caracas, the largest real estate market in Venezuela and the fourth largest economy in Latin America. It is also the fi rst article that measures the effect of expropriations and invasions on the prices of (neighboring) houses.
The authors analyze the microeconomic determinants of the price of housing in the metropolitan area of Caracas and the magnitude of their effects from 2008 to 2009. The article is divided into four sections. The fi rst section develops a conceptual framework concerning the valuation of real estate assets using a Hedonic pricing model

© 2013 Published by Elsevier Inc.
and provides the background, functional forms, and the most important conclusions found in the literature. The next section describes the main components of the data, as well as the descriptive statistical indicators. The authors present their adaptation of the model to the analysis of this particular data set and present the results for the metropolitan area of Caracas and for each of the fi ve municipalities that comprise it in the third section. Finally, the main empirical results are highlighted and the conclusions are provided in the last section.
2. Literature review concerning the Hedonic pricing model This section develops the framework for real asset valuation using a Hedonic pricing model, its background, the different functional forms this model may take, and some of its most important contributions.
2.1. The Hedonic pricing model The idea behind Hedonic pricing is simple. If a property is made up of a series of attributes (which may be heterogeneous), then its market price must be an aggregate of the individual prices of all of them. The Hedonic pricing model is relatively straightforward as it is based on actual market prices and, if data are readily available, it can be relatively inexpensive to apply.
Unlike the majority of economic goods, buildings are characterized as being heterogeneous goods, something that makes them virtually unique and unrepeatable. However, what is known in the market is the composite price that contains no information regarding the marginal prices of the attributes that build it up. It is necessary to determine the implicit price (i.e., the Hedonic price) or contribution
where α represents the coef fi cient of Box and Cox (1964) and whose determination provides the requested functional form. Eq. (1) adopts the linear form when α is one, and the logarithmic form when α is zero. Empirically, the hypothesis of a linear relationship has been ruled out, fi nding values of α close to zero leading to the conclusion that the functional form tends to be very approximate to the logarithmic form ( Figueroa & Lever, 1992 ). This means that the impact of changes in the explanatory variables on the price tends to decline as the variable increases and vice versa.
of each of these attributes within the total price due to their high heterogeneity and ease of differentiation.
Regression analysis based on the Hedonic pricing model has been used at length in the housing economics literature to analyze the relationship between the price of a unit of real estate and its attributes. A review of the use of the Hedonic model in real estate research can be found later in this section.
2.2. Microeconomic foundations of the Hedonic pricing model From a theoretical standpoint, Cropper, Deck, and McConnell (1988) , carrying a simulation where consumers bid for fi xed housing stock, arrive at the conclusion that the Box and Cox (1964) transformation provides the most accurate estimates of marginal attribute prices when all attributes are observed (perfect information). When variables are not observable or are instead represented by a proxy, a simple linear Hedonic price function consistently outperforms the Box and Cox (1964) function, which provides biased estimators of hard-to-measure attributes. We have chosen a linear Hedonic price function as their interest lies in evaluating the impact on housing prices of a number of variables particular to the Venezuelan market and they are either not fully observable (expropriation and invasions risk) or do not belong to the realm of knowledge readily available to the average house buyer (homicide per 100,000 inhabitants, average income per family).
Many authors place the origin of the Hedonic pricing methodology in the work carried out by Court (1939) for the determination of prices in the automotive market ( Sirmans, Macpherson, & Zietz, 2005 ). Others place the origin of the Hedonic pricing methodology 17 years earlier, when Hass (1922) applied it to the calculation of the prices of cropland. Wallace (1926) continued this line of research in Iowa. Three years later, an application of the Hedonic pricing model was also found in a study of the quality of vegetables by Waught (1929) . The common goal of these works is to analyze the price of a good by studying variations in the quality of the product, as represented by certain characteristics or attributes.
Subsequently, Houthakker (1952) and Tinbergen (1956) sought to build a theoretical formulation to justify the relationship between price and quality, which was eventually developed by Lancaster (1966) in his new approach to the consumer theory. This laid down the theoretical foundations supporting the Hedonic price model (i.e., that consumers derive their utility from the characteristics of a property and not from the properties themselves).
The functional form most recommended in the literature is the semi-logarithmic form as it fi ts particularly well to the data. Additionally, the coef fi cients can be interpreted as the percentage increase in the price of a good to a variation of a unit in the independent variable ( Coulson, 2008; Halvorsen & Palmquist, 1980 ). For characteristics with binary measures, this interpretation is valid if the estimated coef fi cient has a small value.
Later on, in 1974, Rosen (1974) provided the microeconomic foundation to the theory of Hedonic pricing and extended the research of Lancaster (1966) to real estate, which would become the paradigm of the Hedonic approach. This work closely follows the approach proposed by Rosen (1974) . The Hedonic regression allows the estimation of a set of points in the intersection of the demand curves of different consumers, with different tastes, and supply functions of different fi rms with (probably) different production technologies. Rosen (1974) argues that the coef fi cients of the Hedonic regression can be interpreted as an approximation of the demand or supply (or neither). Indeed, if consumers are identical (in terms of income and tastes), but suppliers differ between them, the resulting Hedonic regression will look similar to a demand curve. Alternatively, if the suppliers are identical in terms of their cost structure and the consumers are different, the estimated parameters will be an approximation of the structure of the supply. However, if consumers and suppliers are heterogeneous (i.e., they have different distributions), the estimated coef fi cients of the Hedonic regressions should be interpreted as the equilibrium prices of those attributes.
2.4. Review of Hedonic applications in the housing market research Every housing unit has a distinct price that is determined, in part, by the overall supply and demand conditions in the local housing market, but also by the different collection of attributes it embodies. Hedonic analysis does so by assuming that each attribute has its own market that is, in turn, governed by a supply and demand of its own. Therefore, each characteristic has a Hedonic price.
Numerous authors have used Hedonic applications to analyze the effects of observable attributes or macroeconomic variables on the housing market. Kim and Park (2005) study the determinants of housing prices in Seoul (South Korea) and its nearby cities, fi nding that the key determinants of changes in housing prices are the price index, changes in the money supply, construction area permitted, and the performance of the stock and bond markets. Wen, Jia, and Guo (2005) construct a Hedonic model of urban housing prices in the city of Hangzhou (China), dividing the characteristics of the property in three components: 1) structure, 2) neighborhood, and 3) location. Selim (2008) analyzes the determinants of the prices of homes in Turkey fi nding that access to water, number of rooms, size, and type of construction are the variables that most affect the price of houses. Nuñez, Ceular, and Millan (2007) con fi rm that the location, area, parking space, and age of a property are statistically signi fi cant determinants of the price of a house in the city of Córdoba, Spain. Finally, Keskin (2008) determines that the price of houses in Istanbul (Turkey) is determined by four types of characteristics: 1) ownership, 2) socio-economic environment, 3) quality of the neighborhood, and 4) geographic features. A number of authors have applied the Hedonic methodology to analyze the value of attributes within the housing markets of their respective country or city of location. Aguiló Safe (2002) examined the Balearic Islands (Spain), Chattopadhyay (1999) explored Chicago (U.S.), Meese and Wallace (2003) analyzed Paris (France), Figueroa and Lever (1992) examined Santiago (Chile), and Marquez (1992) used Guanare and Maracaibo (Venezuela). Additionally, Coulson (2008) presents a comprehensive 2.3. Functional forms Neither the model developed nor subsequent contributions to Rosen (1974) have established a criterion for selecting a functional form that provides better results. This problem, in essence, has become an empirical question. In order to assess the appropriateness of different functional forms, one would have to know the true marginal contribution of (consumer’s willingness to pay for) attributes and to contrast that with the gradient of the particular Hedonic price function. The obvious dif fi culty in obtaining such data has led to the widespread use of goodness-offi t. Traditionally, the most commonly used functional forms have been the linear, semi-logarithmic, and the double-logarithmic.
In 1964, Box and Cox provided a theoretical tool to determine the exact functional form from the following general expression:


review of the use of the Hedonic pricing model in real estate. These contributions demonstrate, despite the theoretical problems derived from estimating the model parameters and the issues inherent to most of real estate data, the ef fi cacy of the Hedonic methodology in determining the factors that in fl uence the price of housing real estate and the quanti fi cation of their magnitudes.
Hedonic pricing models are also used to estimate the marginal contribution to housing equilibrium prices of certain either unobservable or hard-to-measure attributes in the housing market. Ridker and Henning (1967a, 1967b) are the fi rst to report an application of Hedonic models to estimate the effect of air pollution on the housing market of St. Louis, Missouri. The negative relationship that these authors found on a measure of sulfate in the air and housing prices motivated the development of the conceptual work of Rosen (1974) and Freeman (1974) and led the way for a larger number of contributions in this area. Most noteworthy among all of these are the three successive papers presented by Palmquist (1982, 1983, 1984) , who use a linear Hedonic model and increasingly re fi ned measures for pollution con fi rmed the signi fi cant and negative correlation on the housing markets of multiple cities in the U.S.
Jim and Chen (2009) use a linear Hedonic pricing model to estimate the value of scenic views in the housing market in Hong Kong. Benson, Hansen, Schwartz, and Smersh (1998) employ a similar work for multiple cities in the U.S. estimating the positive impact of scenic views, with sea views carrying the highest positive impact (60%). Alternatively, Lake, Lovett, Bateman, and Day (2000) report the signi fi cant negative impact of industrial views on home values.
Sander and Polaski (2009) , with identical modeling, reported a signi fi cant positive impact of open space on the housing market of Ramsey County, Minnesota. Using linear Hedonic pricing, a number of authors also report a signi fi cant positive impact on housing prices of open space and protected areas ( Bolitzer & Netusel, 2000; Hobden, Laughton, & Morgan, 2004; Lutzenhiser & Netusil, 2001 ).
A signi fi cantly lower number of works focus on the negative impact of crime on property values. This literature focuses on metropolitan areas, and relies on cross-sectional variations in crime rates and property values to draw estimates from the marginal impact of crime ( Burnell, 1988; Gibbons, 2004; Lynch & Rasmussen, 2001; Thaler, 1978 ). Taking advantage of a ten-year database and exploiting the contrast brought about by sharp drops in crime rates in the U.S. during the 1990’s, Pope and Pope (2012) depart from the standard linear Hedonic model and adopt a panel perspective in their assessment of crime rates on property values. Within a fi xed effects framework eased by the panel structure of their data, the authors conclude that decreasing crime leads to higher property values, which accelerate as you move along the income dimension of the municipalities (i.e., wealthier neighborhoods experience a greater increase in property value in response to a drop in crime rates).
The effects of expropriations and illegal occupation on the value of property have not been addressed in the literature. This may be due two factors. First, there are relatively few countries around the world where such events (expropriations and illegal occupations) are so widespread as to allow a systematic study and, in those cases where they exist, the information required is not available. Additionally, there are dif fi culties associated with gathering data concerning expropriations on a localized basis. The authors take advantage of a cross-sectional data set of 17,526 housing transactions in a violent and institutionally weak country to exploit cross-municipality differences in a quest to determine the impact of crime, expropriation, and illegal occupations on housing prices.
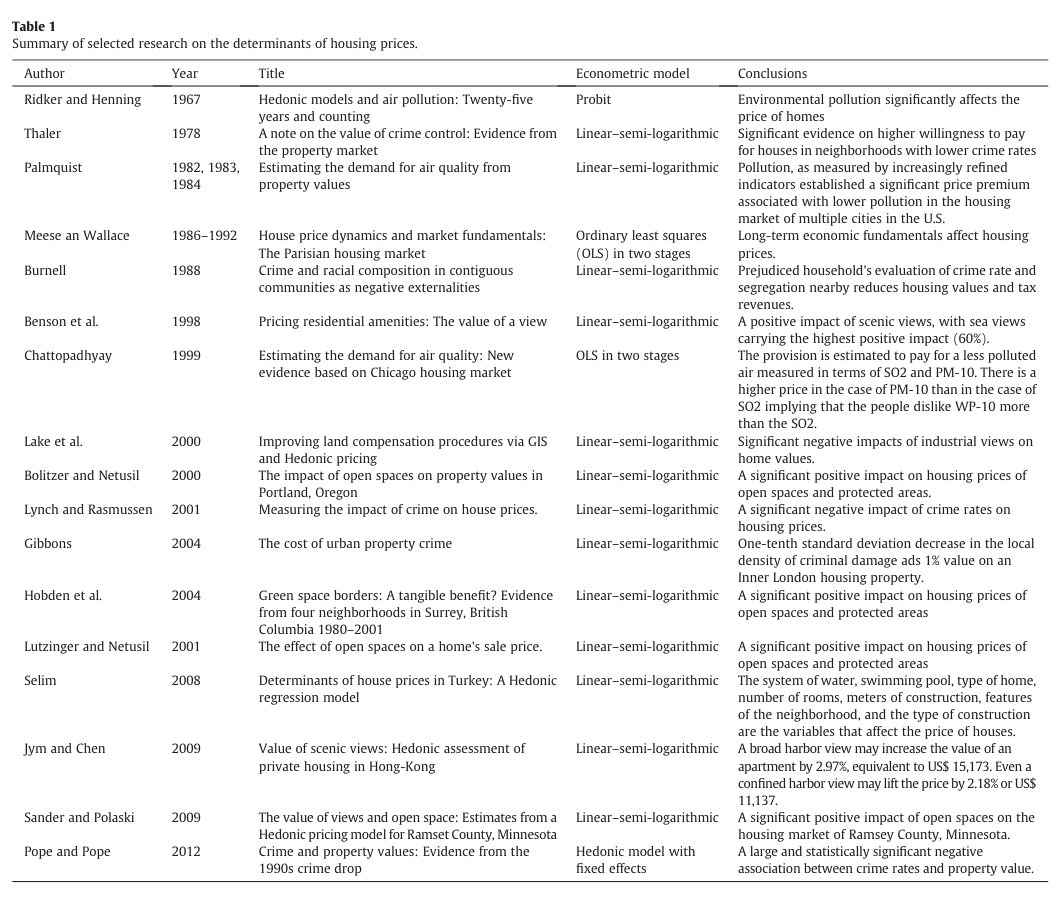
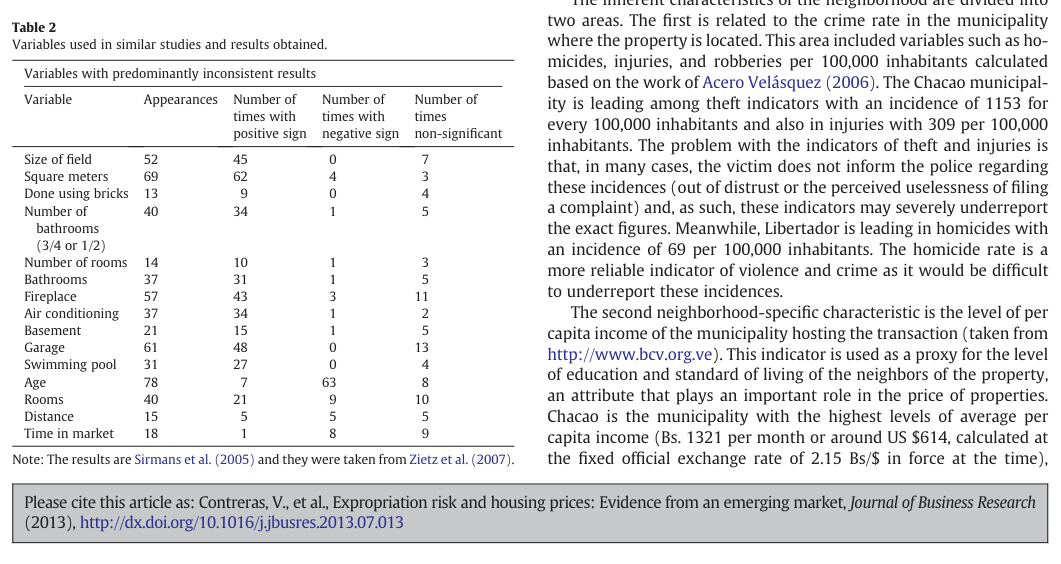
Table 1 summarizes the major fi ndings of the research reviewed here and Table 2 includes a summary table from Sirmans et al. (2005) and Zietz, Zietz, and Sirmans (2007) providing the variables typically included in studies of this type specifying the result of the signs and the number of times that these variables were not signi fi cant.

3. Geographical area of study and data 3.1. Geographical area of study The Metropolitan District of Caracas (MDC) is where most of the administrative, fi nancial, and educational activities of Venezuela are located. It includes the capital and the surrounding area and is the headquarters of many federal authorities. The MDC represents the largest concentration of population in Venezuela and, in itself, comprises the following fi ve municipalities: 1) Baruta, 2) Chacao, 3) El Hatillo, 4) Libertador, and 5) Sucre. Unof fi cial estimates often place the total population of MDC above the four million mark.
3.2. The data This study uses data provided by one of the most important banking institutions in the country, which includes 17,526 recorded prices of transactions of purchase and sale of residential real estate located in the MDC, as well as its most important features. These transactions occurred between January 2008 and August 2009. The quality of the data is somewhat guaranteed by the fact that these operations were carried through a mortgage requiring the bank to objectively assess the value of the property (to issue a loan in accordance to it and the credit capacity of the buyer) and the operations to be registered before of fi cial authorities.
Of these 17,526 transactions recorded from 2008 to 2009 by this bank, 6967 (39.75%) were carried out in the Libertador municipality, 3991 (22.77%) in Sucre, 3469 (19.79%) in Baruta, 1786 (10.19%) in Chacao, and the remaining 1313 (7.49%) in El Hatillo. It is important to note that there may be a possible underestimation of the actual number of transactions in some parishes and municipalities due to the informality that characterizes the real estate market in some of these areas, particularly in the poorest neighborhoods.
The inherent characteristics of each of the 17,526 transactions are divided into the following four sections: 1) structural, 2) location, 3) neighborhood, and 4) other. The structural characteristics are defi ned as those implicit in the transaction or that are of direct measurement. The authors consider the price per square meter, the area of construction in square meters (Mt 2 ), the number of parking spaces, the age of the building, and the market hosting the operation (i.e., primary or secondary). All of this information is available in the database provided by the bank. Unfortunately, the database did not contain other potentially useful information, such as the number of bedrooms or the number of bathrooms per house/apartment.
The other three sections (location, neighborhood, and other) are included to try to capture all the factors that may signi fi cantly affect the amount of the asset, but that may not be attributable to the property per se or are not included directly in the contract of sale. 64.6% of transactions were carried out for amounts of less than 4700 Bolivars/ Mt 2 (or US $2186 at the of fi cial exchange rate of 2.15 Bs/US$ in force at the time) and only in 15.10% of the cases, the amount of the transaction exceeded the 6.246 Bs/mt 2 mark (or US $2905). Regarding the size of the housing property (square meters), 74.7% of the transactions belong to residences of less than 116 m 2 and 62.55% of the transactions were concentrated in the 58 m 2 and 116 m 2 range. 61.79% of the properties in the database had one or more parking spaces, and that in 57.04% of the cases included a range between one and two parking spaces. As to the age of the building, by the time of the transaction, in only 1.15% of the cases, the property was less than ten years old, while in more than 89% of the cases, the age of the building exceeded 20 years. Buildings more than 50 years of age exceed 25% of the sample. Finally, among the set of structural variables, 26.6% of transactions were in the primary market registering a total of 4656 transactions, while the remaining 73.43% were transactions in the secondary market with a total of 12,870 transactions.
The inherent characteristics of the neighborhood are divided into two areas. The fi rst is related to the crime rate in the municipality where the property is located. This area included variables such as homicides, injuries, and robberies per 100,000 inhabitants calculated based on the work of Acero Velásquez (2006) . The Chacao municipality is leading among theft indicators with an incidence of 1153 for every 100,000 inhabitants and also in injuries with 309 per 100,000 inhabitants. The problem with the indicators of theft and injuries is that, in many cases, the victim does not inform the police regarding these incidences (out of distrust or the perceived uselessness of fi ling a complaint) and, as such, these indicators may severely underreport the exact fi gures. Meanwhile, Libertador is leading in homicides with an incidence of 69 per 100,000 inhabitants. The homicide rate is a more reliable indicator of violence and crime as it would be dif fi cult to underreport these incidences.
while Sucre has the lowest average (Bs. 649 per month or around US $302). It is noteworthy as an indicator of the income inequality that characterizes the Metropolitan Area of Caracas that 79.6% of the transactions in the data set involve neighborhoods with an average income lower than the overall average of Bs. 945 per month (or around US $440).
The proximity of the transaction, measured in months, is another variable included in the study. The premise for inclusion of this variable is to account for the effects of in fl ation in Venezuela and also to consider the possible effects of changes in the economic and real estate business cycle. This variable takes a value of one if the operation was conducted in January of 2008, two if it occurred in February of 2008, three if it was conducted in March of 2008, and so on. In Figure 8, 83.9% (14,711 transactions) of the transactions were carried out in 2008, while the average transaction occurred around the months of July and August of 2008 (7.6 months).
The authors tried to incorporate a proxy for the risk of expropriation as a variable that has become increasingly important in Venezuela, a country where, for example, in March 2006, two years before the beginning of the sample period, President Hugo Chávez had already announced that it would expropriate the properties of those owners unwilling to sell at regulated prices (taken from http://www.globalpropertyguide.com/investment-analysis/Rise-ofthe-left-the-fall-of-real-estate , where it was translated from Spanish to English). For instance, “ If someone in Caracas has fi ve apartments and refuses to sell at the right price, we will implement a decree of expropriation for public good and will pay the owner what the property is really worth. ” Additionally, as published by the newspaper El Universal (2010, October 19) (the translation to English is ours): “ Between 2005 and 2009, the Venezuelan Government has executed 762 forced expropriations of land and businesses, with an upward trend in the last year, when 374 cases have been recorded. ” These announcements have been followed by an increasing number of land invasions throughout the country. Expropriated properties are usually paid by the government at below market prices and it may take years for the owner of an expropriated property to collect any payment. In many cases, the police do not act upon property invaders. Based on fi gures for expropriations and invasions provided by the Civil Association for Leadership and Vision (Liderazgo y Visión) for the period 2008 – 2009, the authors built an index in an attempt to measure the effect of perceived expropriation and invasions risks on the prices of residential real estate. The index was calculated as the total number of these incidents that occurred in a certain municipality divided by the number of transactions recorded in the bank’s database for that municipality.
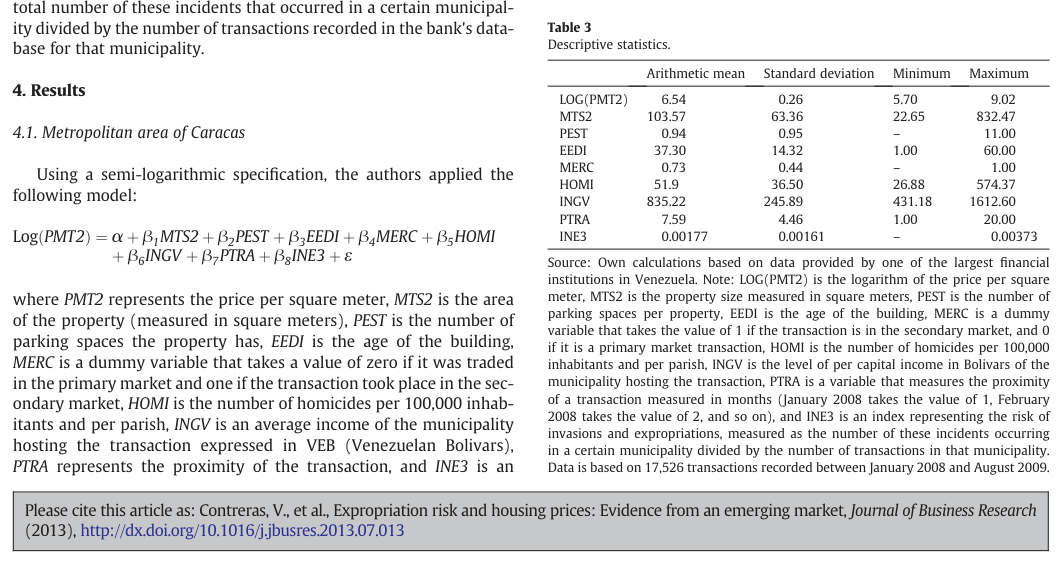
index representing the risk of invasions and expropriations, measured as the number of these incidents occurring in a certain municipality divided by the number of transactions in that municipality.
A summary of the most important descriptive statistics of the variables used in the model can be found in Table 3 .
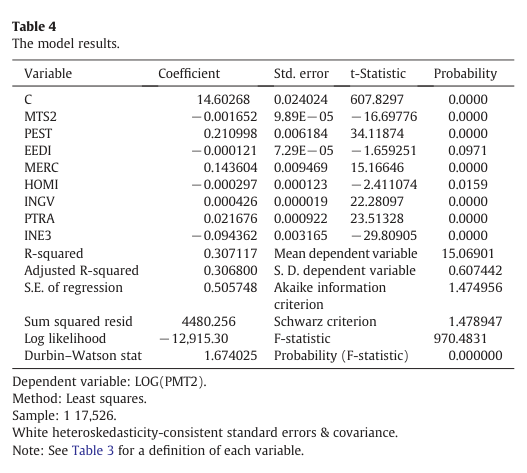
The regression is performed using an estimation of the variance of White under the assumption of heteroskedasticity, so that the results obtained are more conservative than those obtained under the traditional methodology of Ordinary Least Squares (OLS). The results of the regression can be found in Table 4 where the signs obtained were as expected. Additionally, the variables for the number of parking spaces and invasions and expropriations as a portion of the transactions are the most signi fi cant judging by the magnitude of the respective t-statistics.
The variable of expropriation and invasion risks yield a fairly high ratio indicating that the value of a property is sensitive to the perceived risk of being expropriated or invaded. This variable is robust to using, as a quotient of the invasions and expropriations, the population of the municipality involved (in the original case, it was the number of transactions in the analyzed municipality) or using the number of such events by municipality.
The variable square meters (Mt 2 ) indicates the appropriate sign and is statistically signi fi cant. Its shape is concave with respect to the origin implying that if the size of a property increases by 1 m 2 , its price per square meter is reduced by 0.17%. This result is consistent with the evidence reported in other studies at the international level.
In the case of parking spaces, if parking space is increased by one, on average, the price of a property (per square meter) would be increased by 21.1%. This high percentage is not surprising as automobiles are the main form of transportation employed by middle class inhabitants in Caracas.
The coef fi cient of the age of the building is negative and signi fi – cantly different from zero, but only if a signi fi cance level of 10% is used. An increase of one year in the age of a property results in a reduction in the price per square meter of only 0.01%. While this variable should have had a larger impact, it can attributed to the short supply of new homes, emphasizing the fact that more than 89% of the transactions in the database correspond to houses that are more than 20 years old. As in the previous cases, this result is consistent with Table 2 (i.e., the age of the building is negative in 63 of the 78 cases analyzed by Zietz et al., 2007 ).
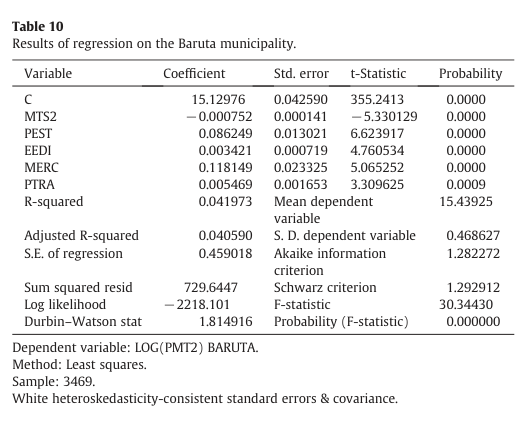
To do so, following regressions are run for each of the transactions in each municipality:
Log PMT2 ð Þ 1⁄4 α þ β 1 MTS2 þ β 2 PEST þ β 3 EEDI þ β 4 MERC þ β 5 PTRA þ ε :
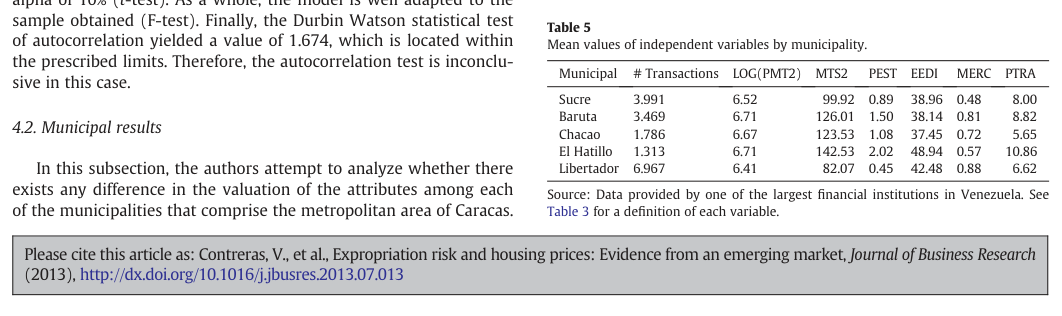
A summary of the averages of the variables used in the model, computed by municipality, is presented in Table 5 .
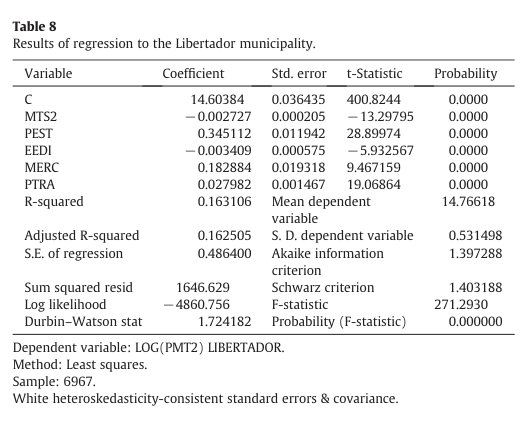
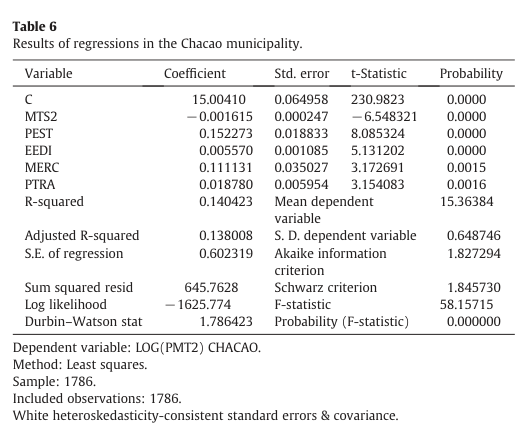
Regression analysis (see Tables 6 – 10 ) indicates that, in general, all of the variables were signi fi cant and statistically different from zero at the 1% level of signi fi cance, except for the age of the building (EEDI) in the case of the El Hatillo municipality. In that case, it results in a non-signi fi cant outcome as in the eight of the 78 cases analyzed in Table 2 of Zietz et al. (2007) . In all of the cases, the model is valid as a whole (F-test).
The signs of the variables, in all cases, behave as expected except for the age of the building in the municipalities of Baruta and Chacao, which have a positive sign implying that the older the property, the higher the price to be paid. This could be explained by the area where the building is located. It appears in those municipalities where urban development began in modern times in Caracas and then extended to the surrounding areas inferring that the best areas were occupied by the fi rst buildings constructed and, therefore, they may have an important geographical value that the model collects through the age variable even though this is an attribute not measured in our model.
If the operation is performed on the secondary market, the price of the property will increase by 14.4%. This counter-intuitive result may be explained by the possibility that the prices paid for properties in the primary market correspond, in many cases, to pre-sale prices, which tend to be lower than the price of an already built property. This form of transaction contains an implicit fi nancing that makes its nominal price lower.
Next, the authors attempt to assess the differences in the valuation of attributes among the fi ve municipalities of Caracas. For example, in the case of the variable parking spaces (PEST), a greater valuation in the Libertador municipality ( − 0.3451) is noted, followed by Sucre, Chacao, El Hatillo, and Baruta (0.0862). This fi nding can be explained by the availability of parking spaces in the municipality. It is much easier to get an apartment with a parking space in El Hatillo than it is in Libertador. As such, the value of the parking space is greater in the Libertador municipality than in El Hatillo municipality.
The homicide variable is negative and statistically signi fi cant and is interpreted in the following way. As the number of homicides per 100,000 inhabitants of the neighborhood involved in the transaction increases by one unit, the price per square meter of the property falls by 0.03%. This particular variable generates robust results in those cases where similar variables, such as injuries, robbery, and rape per 100,000 inhabitants, are used. In all of these cases, the sign is correct and the variable is signi fi cant and statistically different from zero.
With regard to the age of the building, removing the cases discussed above, the loss of value as a result of the age of the building is determined by the number of new projects or ongoing projects. For instance, if Sucre ( − 0.0059) is compared with Libertador ( − 0.0034), Sucre has many new construction sites (e.g., Parish Leoncio Martínez). There is a wider range of options when purchasing a property thereby punishing the price of older structures. In the case of Liberator, this municipality offers fewer new properties limiting the options that are available. The case of El Hatillo is slightly different as properties in this municipality are largely new or relatively new.
The neighborhood income and proximity of the transaction variables are positive and statistically signi fi cant. The fi rst variable has a fairly low value, so when buying, while it is important, it doesn’t signi fi cantly affect the price of the transaction. In the second case, the variable proximity of the transaction is positive and statistically different from zero. As the date of the transaction approaches, the price of the property increases by 2.17% for each unit or additional month. This is most likely due to in fl ationary issues and it is important to note that average in fl ation in the years 2008 – 2009 is 2.2% per month.
Finally, the market where the operation is performed indicates signi fi cant differences between municipalities. This may be attributed to the coef fi cient capturing some of the attributes of the geographic location of housing. Aside from the differences previously mentioned, the results obtained for the general sample remain consistent with those obtained at the municipality level.
With regard to R 2 and adjusted R 2 of the regressions, note that they are 30.71% and 30.68%, respectively, two values that are similar to those obtained in previous studies throughout the world. Individually, all of the variables are statistically different from zero with an alpha of 10% ( t -test). As a whole, the model is well adapted to the sample obtained (F-test). Finally, the Durbin Watson statistical test of autocorrelation yielded a value of 1.674, which is located within the prescribed limits. Therefore, the autocorrelation test is inconclusive in this case.
5. Conclusions The main contribution of this article to the literature in Hedonic pricing models applied to real estate is the inclusion and quanti fi cation of
the effects of perceived expropriation and invasion (illegal occupation) risks at the municipality level as key determinants of housing prices. This is the fi rst attempt to quantify these impacts in the Hedonic pricing literature applied to real estate. The particular institutional characteristics of some countries in Latin America, and of Venezuela in particular where land invasions and expropriations have been common threats to property owners, provides the authors with an opportunity to test the effects of these risks on housing prices using a unique database. There was a signi fi cant and negative effect of these risks on housing prices. The fi ndings are robust to the different ways in which a property invasion and expropriation’s risk index may be constructed. The Venezuelan economic and business environment (e.g., 762 expropriations from 2005 to 2009, a period that includes the two years of this study, 2008 and 2009, and two years prior) provides a unique setting to test these effects and specify their particular impact on housing prices.
The authors employed a reasonable Hedonic function that uses attributes as input and forms the market price of the unit as its output. The parking spaces variable and invasions and expropriations risks were the two most signi fi cant variables judging by the coef fi cients of the t-statistics. Furthermore, the market where the operation is performed, whether primary or secondary, the square meters of construction, the age of the building, the income level of the
neighborhood, the period of the transaction, and the number of homicides per 100,000 inhabitants (a proxy for neighborhood violence), are all statistically signi fi cant variables. The whole model is reasonably adapted to the data at any level of signi fi cance (F-test).
Similar models were run for each of the municipalities to determine whether there were differences among them. It should be noted that the parking space variable is not signi fi cant in the El Hatillo municipality. Alternatively, the coef fi cient for the variable age of the building exhibited a negative sign in the cases of the municipalities of Baruta and Chacao, contrary to the results obtained in the general model and in the rest of the surveyed municipalities. Despite these differences, the results remained consistent with those found in the general model.
Acknowledgment The authors thank the editors and the anonymous referees for the comments and suggestions received during the reviewing process. We would also like to thank participants at the Business Association for Latin American Studies (BALAS) 2012 Annual Conference in Rio de Janeiro, Brazil, for their helpful comments.
References
