Transcripción completa del PDF reformateada para lectura web. Descargar PDF original para tablas, figuras y referencias.
Contents lists available at ScienceDirect
journal homepage: www.elsevier.com/locate/jbusres
Place-specific determinants of income gaps: New sub-national evidence from Mexico ☆
Ricardo Hausmann a , Carlo Pietrobelli b , Miguel Angel Santos c , * A R T I C L E I N F O A B S T R A C T The literature on wage gaps between Chiapas and the rest of Mexico revolves around individual factors, such as education and ethnicity. Yet, twenty years after the Zapatista rebellion, the schooling gap has shrunk while the wage gap has widened, and we find no evidence indicating that Chiapas indigenes are worse-off than their likes elsewhere in Mexico. We explore a different hypothesis and argue that place-specific characteristics condition the choices and behaviors of individuals living in Chiapas and explain persisting income gaps. Most importantly, they limit the necessary investments at the firm level in dynamic capabilities. Based on census data, we calculate the economic complexity index, a measure of the knowledge agglomeration embedded in the economic activities at the municipal level. Economic complexity explains a larger fraction of the wage gap than any individual factor. Our results suggest that the problem is Chiapas, and not Chiapanecos .
1. Introduction
In this study, we propose a different approach, and argue that place- specific characteristics condition the choices and behaviors of in dividuals living in Chiapas and explain persisting wage gaps. Most importantly, place-specific characteristics limit firm-level investments in the organizational and technological capabilities required to take advantage of market opportunity dynamics, and therefore, explain the state ’ s slower economic growth ( Sainsbury, 2020 ). This study represents an original contribution to the literature in at least two ways. First, it builds on the dynamic capability theory of economic growth by explicitly considering place-specific factors and economic complexity indicators. Second, it tests this approach with novel empirical evidence at the sub-national level in a Mexican state often studied as a paradig matic example of a laggard state, despite the substantial policy efforts financed by the federal and the local governments to revert this trend.
Chiapas is not only the poorest state in Mexico, but also the one growing the least. Challenging the predictions of the neoclassical theory of growth, instead of converging, Chiapas is diverging; the wage gap relative to the rest of Mexico continues to widen. That reality is at odds with the vast resources pumped into the region by the federal govern ment since the Zapatista uprising on January 1st, 1994, and the signif icant improvements in educational attainment and infrastructure that have followed. Why does the wage gap continue to broaden regardless? How can we account for such a paradox? Most of the efforts aimed at explaining this puzzle have focused on individual or household factors, such as indigenous origins, education, or asset endowment ( de Janvry & Sadoulet, 2000; Lopez Arevalo & Nu ̃ nez Medina, 2015; World Bank, 2005 ). Yet, when all these factors are considered, 60% of the gap remain unexplained.
Our first contribution — more relevant to theory — starts by acknowledging that the neoclassical theory of economic growth does ☆ The authors want to thank the Inter-American Development Bank (IDB) for financing the initial research study that motivated the paper. The opinions expressed here do not necessarily reflect those of the its Executive Directory, or countries represented in the bank. We are also grateful to Jose Ernesto Lopez-Cordova, Karla Petersen, Dan Levy, Johanna Ramos, Sebastian Bustos, Luis Espinoza, Tim Cheston, Patricio Goldstein, Patricia Yanes, and Antonio Vezzani, for useful comments and suggestions that contributed to strengthening our arguments, as well as two anonymous referees for their constructive feedback. The usual disclaimers apply.
* Corresponding author. E-mail address: miguel_santos@hks.harvard.edu (M.A. Santos).
https://doi.org/10.1016/j.jbusres.2021.01.003 Received 1 April 2019; Received in revised form 30 December 2020; Accepted 2 January 2021 Available online 16 January 2021 0148-2963/© 2021 Elsevier Inc. All rights reserved.
little in explaining the diversity across countries in income growth rates recorded in recent decades. Although what are today the rich G7 countries dominated the world economy during last century, since the 1990s, several emerging countries, primarily from Asia, have caught up with impressive rates of growth. We argue that a growth theory based on an explicit account of dynamic capabilities may provide more convincing answers. Following authors such as Freeman (2019) and Sainsbury (2020) , “ the rate at which a country ’ s economy grows de pends on whether its firms have the capabilities to generate and exploit the windows of opportunity they see for innovation and technical change in their industries, and whether over time they are able to enhance their technological and organizational capabilities ” ( Sainsbury, 2020, p.13 ). Dynamic capabilities, that is, the organizational capabil ities that are most concerned with change ( Winter, 2003, Teece, 2017 ) are most important in this regard. 1 This approach is in line with a modern strand of literature searching for place-specific explanations of development and income gaps. These studies emphasize how cities and regions have complex economic development processes shaped by an extensive range of forces ( Storper, 2011 ). The dynamic capabilities and market opportunity dynamic that apply to sectors at the national level can explain the different fortunes of places and regions ( Sainsbury, 2020 ). Moreover, this academic trend has occurred together with a recent surge of interest in advanced countries for policies such as the smart specialization strategy of the European Union ( McCann & Ortega- Argil ́ es, 2015 ), and the various initiatives undertaken by several states in the United States of America ( Neumark & Simpson, 2014 ). In particular, smart specialization evolved as a response to the challenges associated with innovation policy design in the European context, while allowing for the varied evolutionary nature of regional economies ( McCann & Ortega-Argil ́ es, 2015 ). In short, smart specialization highlights the importance of focusing industrial and innovation policies on a set of priority areas based on the existing strengths of a region (place) that may allow grasping new market and technological opportunities ( Foray, 2015 ), both at the local and global scale. This process can eventually trigger an industrial transformation toward a more valuable configura tion based on dynamic competitive advantages ( Vezzani et al., 2017 ).
them.
This study also offers an additional original contribution because Chiapas, beyond its ethnic diversity and conflictive past, is a paradig matic state in terms of the failed policies to promote its development and catching up. Since the uprising of the Ej ́ ercito Zapatista de Liberaci ́ on Nacional (EZLN) in 1994, Chiapas received a significant amount of policy attention and resources from the federal government. The federal government launched a vast array of social programs, targeting the most vulnerable families in the state. Cash transfers, together with large in vestments in education and infrastructure, were the workhorses of the federal effort to appease the region ( Aguilar-Pinto, Tu ̃ n ́ on-Pablos, & Morales-Barrag ́ an, 2017, Van Leeuwen & van der Haar, 2016 ). Conse quently, its road, port (Puerto Chiapas), and airport (Tuxtla Guti ́ errez, Tapachula, and Palenque) networks improved remarkably, and since 1965, the schooling gap between Chiapas and the rest of Mexico has been declining. Yet, the income gap continues to widen, suggesting that none of these was the most binding constraint.
Analyzing the factors associated with poverty in Chiapas, we find that a significant fraction of the income per worker gap remains unex plained when accounting for individual factors such as quantity and quality of education, gender, or indigenous origins. Instead, place- specific factors help explain much more of the gap, also among different municipalities within the state of Chiapas. Indeed, some of them managed to accumulate the dynamic capabilities required by modern production systems, and this increased their complexity, while others have remained stagnant, mostly devoted to subsistence agriculture.
Our findings suggest that solving the coordination problem embedded in the chicken-and-egg dilemma is essential to jump-start the economy of Chiapas, promote structural transformation, and foster convergence. Failure to do so will render the investments the state has made in education and infrastructure fruitless.
The structure of this paper is as follows: In Section two, we charac terize the growth trajectory of Chiapas over the twenty years spanning from 1990 to 2010. Section three aims to explain the wage gap between Chiapas and the rest of Mexico as a function of individual factors. In Section four, we analyze the evolution of two place-specific factors that are usual suspects when it comes to explaining wage gaps: access to finance and infrastructure. In section five, we introduce the notion of economic complexity and estimate an employment-based complexity index at the municipal level in Mexico. In Section six, we test if our index of economic complexity — a proxy for the knowledge agglomeration of places — is informative of future growth rates at the municipal level in Mexico. Once this is confirmed, in Section seven we analyze the wage gap by incorporating our measure of economic complexity. Section eight presents the conclusions and some policy implications.
In this study, we contribute to the search for the place-specific de terminants of income growth and gaps, the concept of economic complexity, a measure of the know-how embedded in the economic activities at the municipal level, and of the state of industrial trans formation in Mexico. Our results suggest that place-specific economic complexity can explain a larger share of the wage gap than any of many individual factors, such as education, experience, indigenous origins, gender, and living environment (rural vs. urban). 2 Chiapanecos are not poor because they lack individual assets, but rather because they lack a modern ecosystem where they can safely invest to develop their dy namic capabilities. Chiapas has fallen into a sort of chicken-and-egg dilemma; modern industries are not present because these places lack the dynamic capabilities required, but no one has the incentives to ac quire such capabilities for industries that do not yet exist.
2. The growth trajectory of Chiapas
Between 1990 and 2010, Mexico registered one of the lowest growth rates in Latin America. The compounded annual growth rate (CAGR) per capita of the nation in those twenty years averaged 0.8%, only higher than Venezuela (0.7%), the Bahamas (0.7%), Jamaica (-0.4%), and Haiti (-1.5%). 3 Within that sluggish context, the growth of Chiapas was sec ond lowest among all thirty-two Mexican states, with a CAGR of − 0.7%, only surpassing Campeche ( − 2.0%). 4 Chiapas ’ performance is in sharp contrast even when compared to Guerrero and Oaxaca (0.1% and 0.3%, respectively), the two poorest states in Mexico after Chiapas.
The same logic helps explain the large income and wage differences observed across places within Chiapas itself, as we do in this study. The income per capita differences between Tuxtla Guti ́ errez, the capital of Chiapas, and Aldama and Mitontic, its poorest municipalities, is about eight times, and many place-specific features are necessary to explain 1 “ An organizational capability is a high-level routine … that, together with its implementing input flows, confers upon an organization ’ s management a set of decision options for producing significant outputs of a particular type ” ( Winter, 2003, p. 991 ).
3 World Development Indicators. 4 The plummeting of Campeche was driven by the accelerated depletion of Cantarell, a giant offshore oil field discovered in 1976, which registered a 74% volume loss between its peak volume in 2004 and 2010. Source: Off-shore technology ( https://www.offshore-technology.com/projects/cantarell/ ) con sulted on February 5, 2020.
2 In our estimates, we use wage gaps rather than income gaps, as wages are more directly related to the economic complexity of the ecosystem. Gaps in gross domestic level per capita level are much larger, because Chiapas ’ workers participate less.
Consequently, the income gap between Chiapas and the rest of Mexico has widened. Although in 1990, the average income per worker in Chiapas was equivalent to 56% of the national average, by the end of 2010, it had plunged to 41%. 5 Poverty rates mirror the expanding in come gap. Either by multidimensional poverty (78.5%) or income poverty (78.1%), by 2010, Chiapas became Mexico ’ s poorest state by far, well above the national average (46.1% and 51.3%). 6 much lower than in the rest of Mexico ( Fig. 1 ). For instance, to earn the income of an individual with six years of schooling in the rest of Mexico, a worker from Chiapas must have at least ten years of schooling. This is true across all schooling levels, although after eighteen years of school (equivalent to a master ’ s degree) the distance is somewhat smaller. 10 Something is causing individuals with the same schooling to earn sys tematically less in Chiapas.
Third, the trajectory of the education gap between Chiapas and the rest of Mexico, as measured by years of schooling, does not parallel the evolution of the income gap. The gap in years of schooling has declined steadily for the cohorts born after 1965. This trend shrinks at an accel erated pace for the cohort born in the late eighties, where it went from 3.2 years on average (cohort born in 1965) to 1.6 years (1987). 11 The differences in income per worker, which are evident across Mexican states, reproduce as a fractal within Chiapas. Tuxtla Guti ́ errez, the state capital, had an income per capita 8.5 times higher than that of Aldama and Mitontic, Chiapas ’ poorest municipalities. Therefore, the search for an explanation for the poverty in Chiapas must go beyond factors that are invariant at the federal and even the state level, such as legal framework, monetary, fiscal, and exchange rate policy, 7 and the banking system. The factors must also account for the large income differences observed within the municipalities of Chiapas. These factors can either be associated with the characteristics of individuals or of the particular sub-regional space.
Finally, education cannot account for the fact that the wage premium between workers in Chiapas and the rest of the country contracts by a factor of six when we examine the income of internal migrants in Mexico. A worker elsewhere in Mexico makes, on average, a 67.6% premium over the average worker in Chiapas. If workers born and educated in Chiapas migrate and work elsewhere in Mexico, they make, on average, 79.7% more than do workers that stay in Chiapas. Now, one might say that migrants self-select, and only the best suited in the population leave the state in search of opportunities. By restricting our comparison to wages of migrants, we account for that possibility. Migrant workers from Chiapas make just 11.2% less than other internal migrants do from elsewhere in Mexico.
3. Poverty determinants in Chiapas: Individual characteristics
The traditional approach to explaining the poverty of countries and regions emphasizes nationwide factors or individual (household) fac tors. Theories based on nationwide factors not only fail to explain large differences in income within countries, but also large differences within the same state. Accounts that focus on individual characteristics as drivers of income differences, attribute poverty to deficiencies in factors such as education, experience, endowments, gender, and even indige nous origins ( Ravallion, 2015; Milanovic, 2016 ). In this section, we test the contribution of some of these individual characteristics to the in come gap between Chiapas and the rest of Mexico.
The differences in the profiles of migrants from Chiapas and the rest of Mexico might still account for the differences mentioned. For instance, perhaps migrants from Chiapas are better educated or have more experience than do other internal migrants. To account for the impact of these and other factors, we ran a regression of incomes derived from work on internal migrants from Chiapas and elsewhere, controlling for individual factors such as years of schooling, experience, gender, indigenous language, and rural location on wages. 12 We have restricted our sample to the population between 12 and 99 years old that declared having a positive monthly income derived from work. 13 Our final sam ple has 2,953,331 individuals, with the corresponding expansion factors provided by INEGI. 14 As the sample has the income variable truncated from above at 999,999 pesos per month (around US $80,000), we have chosen a Tobit specification. We measure the impacts of these on the income derived from work in Mexico at the municipality level, and in each case, include an interaction with a dummy indicating if the subject was born in Chiapas, to capture the incremental impacts on workers within the state (with respect to the national average). Table 1 reports the results.
3.1. Education Chiapas has the lowest education attainment in Mexico. By 2010, its labor force had, on average, 8.1 years of schooling, in contrast to 9.7 years in the rest of Mexico. The bulk of the difference was concentrated in the lowest educational levels. In particular, 13% of the labor force had zero schooling (5% at the national level), 21% did not finish primary school (twice the national average), and 23% did not finish secondary school (20% at the national level). 8 The results from standardized tests ENLACE 9 indicate that Chiapas was among the worst states in Mexico in the Spanish language, and yet, there are compelling reasons to believe that education was not constraining growth in Chiapas.
Once we control for other variables that potentially influence labor income, we see that wage differences largely disappear. Let us assume the average salary per worker in Mexico is equal to 100, 67.6% higher than that of Chiapas ’ workers, who in that scale would earn 59.6. When a worker migrates into another state in Mexico, she earns a premium of 13.9 percentage points (the coefficient of Migrant in specification 1), totaling 113.9. A worker from Chiapas obtains an average premium of 51.2 percentage points when migrating to other Mexican states, 15 First, the magnitude of the difference in years of schooling and experience does not bear any resemblance to the large differences observed in income. By 2010, an average worker in Chiapas had 8.1 years of schooling and 22.7 years of experience, in contrast to 9.6 and 21.7 years in the rest of Mexico. These gaps are relatively small and can hardly explain the 60% wage gap between Chiapas and the rest of the country.
Second, for all schooling levels, income per worker in Chiapas is 10 These results hold even if we control for the quality of education, measured by ENLACE. The problem is that ENLACE is a more recent test and we shall attribute to cohorts of workers a quality of education that does not necessarily correspond to the education they did receive. The results are available from the authors upon request.
8 These statistics were calculated based on the Population Census of 2010, and correspond to all individuals with at least 12 years of age and active in the labor force.
9 ENLACE is a standardized test in Spanish and Mathematics, that the Min istry of Education administered from 2006 to 2013 from grades third to six (last four years of primary school), and last year of secondary school. Between 2009 and 2013, the test was administered across all years of secondary school.
13 Twelve years is the threshold used by INEGI in their labor market statistics. 14 Appendix I includes a table summarizing the descriptive statistics. 15 That is, the sum of coefficients of Migrant and the one of interaction Chiapas – Migrant in specification 2.
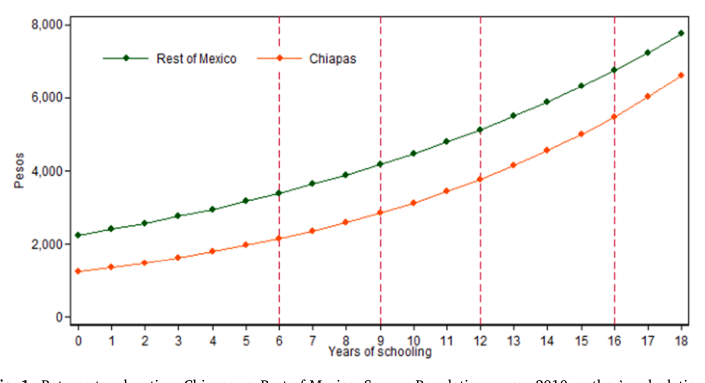
Fig. 1. Returns to education: Chiapas vs. Rest of Mexico. Source: Population census 2010, author ’ s calculations.
hypotheses. First, because the safe combination of cheaper cost of living, subsistence agriculture, and conditional cash transfer programs ( Pros pera 17 ) , offers a sharp and positive contrast to the risky migration to urban areas. Second, because indigenous people in Chiapas are usually located at ejidos , or communal property plots. The fact that they benefit from usage, but cannot sell or rent property, raises the opportunity cost of an eventual migration. Finally, many of these communities are gov erned by the Usos y Costumbres system, a form of self-determination where indigenous authorities enforce a set of particular rules that regulate life in the villages. Although there are different Usos y Cos tumbres depending on ethnic groups, most of them contemplate cash- penalties for migration, eventually leading to loss of property, and even expulsion ( Santos, Hausmann, Levy, Espinoza, & Flores, 2015 ).
Table 1 Tobit regression of income per worker and migrants, controlling for years of schooling, experience, gender, indigenous origins.
3.2. Indigenous origins Another individual factor often mentioned when explaining why workers in Chiapas earn lower salaries is the indigenous origin of a significant share of its population. Indeed, after Oaxaca (35%) and Yucatan (33%), Chiapas (27%) has the third largest share of individuals speaking an indigenous language among all Mexican states.
The results in Table 1 indicate that individuals speaking indigenous languages do earn wages that are 25% lower than otherwise; however, there is no evidence indicating that indigenous people in Chiapas earn significantly less than do their counterparts elsewhere in Mexico. The coefficient of the interaction between indigenous language and having been born in Chiapas is negative (-0.104 in specification 3); however, it is not significant, despite the large number of observations.
t values are indicated beneath the coefficients. *** p < 0.01, ** p < 0.05, * p < 0.1.
The methodological challenge here lies in differentiating individual characteristics (speaking an indigenous language) from the character istics of the places where these communities live. To address this, we use the Oaxaca-Blinder method to decompose the differences in average income between Chiapas workers and those from the rest of Mexico ( Blinder, 1973; Oaxaca, 1973 ). Intuitively, the Oaxaca-Blinder decom position aims at explaining what would happen if workers from Chiapas had the same average features (schooling, experience, shares of female, indigenous, and people living in rural areas) as the rest of Mexico.
ending with a total salary of 110.9. Comparing Chiapanecos working out of Chiapas with other Mexican workers working out of their state of origin, the wage difference shrinks to 2.7%. Thus, Chiapas migrants earn a salary that is roughly similar to other internal migrant workers in Mexico with similar schooling, experience, gender, and indigenous origin.
Despite the good fortune that accompanies Chiapas ’ workers when they leave the state, migration rates are among the lowest in Mexico. This is particularly true in rural areas, where the migration ratio (1.42 per 1000 inhabitants) is less than half of elsewhere in rural Mexico (3.42). 16 Why do rural Chiapanecos not migrate more often? From our field experience in Chiapas, we derived three complementary
Table 2 reports the results in two different forms. The left-hand side panel (columns 1 and 2) decomposes the difference in the log of mean
17 Prospera is a federal program of conditional cash transfers aimed at families in extreme poverty. The program brings together different institutions at the federal and regional level, including the Secretary of Public Education, Secre tary of Public Health, Mexican Institute of Social Security, as well as State and municipal governments.
The share of households and firms (or economic units, EUs) that obtained external financing in Chiapas in 2008, as well as those financed through banks, is close to the national average. According to the 2009 Economic Census, around 30% of Chiapas ’ EUs did not have financing in 2008, versus 28% at the national level. Similarly, 32% of EUs that secured external credit did it through banks, which is in line with the national average (from 19% in Oaxaca, to 52% in Nuevo Le ́ on). Credit access in Chiapas does not look different from the rest of Mexico.
Table 2 Oaxaca-Blinder decomposition: Factors associated to differences in the mean of income per worker Chiapas vs. Rest of Mexico.
Moreover, we can detect growth constraints by analyzing both quantities and prices. As it turns out, the cost of credit in Chiapas is among the lowest of all Mexican states, throughout the range of enter prise sizes. Real interest rates in the state are also 0.7 percentage points below the national average for small and medium-sized enterprises, and 1.9 for large enterprises. 18 The empirical evidence suggests that low levels of credit to the private sector in Chiapas are driven by the low productivity of its economy, not by bottlenecks in credit markets or insufficient credit supply.
The other usual suspect when it comes to place-specific determinants of poverty is poor infrastructure. Chiapas is traversed from north-west to south-east by two mountain ranges, which create very distinct climatic zones and represent a challenge to the build-up and maintenance of infrastructure. Despite this, we have found no evidence of infrastructure being the most significant binding constraint in Chiapas.
Considering area and population, Chiapas ranks above the Mexican average in terms of paved roads and four-lane roads. Fifteen years ago, Davila, Kessel, and Levy (2002) identified the radial nature of roads in Mexico with respect to its capital, as one of the most important con straints to the development of the South. The authors suggested several infrastructure developments to overcome this obstacle, which would have produced savings in distance and time. Most of these projects have been completed by the end of 2013. As reported by Hausmann, Espi noza, and Santos (2015) , the savings in distance and time associated with these infrastructure developments were not only achieved, but in some cases even surpassed. Yet, as it happened with schooling, none of these improvements translated into higher incomes or lower poverty rates.
income in three components: characteristics, coefficients, and in teractions. The right-hand side panel (columns 3 and 4) contains a similar decomposition, but instead of logs, it presents the results in percentage terms. The rows of the characteristics represent what would happen if we endowed Chiapas workers with the average level observed for each of these variables in the rest of Mexico. The coefficient row represents what would happen if we were to give Chiapas workers the same returns observed in the rest of Mexico for these characteristics. Finally, the interaction panel represents what would happen to Chiapas workers if they possessed the same impact of the interactions between characteristics and coefficients observed in the rest of Mexico.
In sum, since the early 2000s, there has been a significant flow of public investment into Chiapas that has reduced the schooling gap, increased access to credit, and improved its infrastructure. However, the wage gap separating Chiapas ’ workers from other Mexican states widened. Neither individual nor traditional place-specific factors can explain why Chiapas has become poorer. To address this issue, in the next section we introduce a new indicator of economic complexity to capture place-specific determinants of income gaps.
The number of people speaking an indigenous language only ex plains a fraction of the difference in the mean wage between workers in Chiapas and those in the rest of Mexico. More explicitly, we find that differences in the number of indigenous people only represent a small fraction of the total difference in income observed between these places (61.3%). These results are in line with de Janvry and Sadoulet (1996), de Janvry, Gordillo, and Sadoulet (1997) , and the World Bank (2005) , all of which conclude that indigenous origin does not itself explain why a worker in Chiapas earns much less than in the rest of Mexico.
5. Economic complexity
The export basket of a place is an indicator of its stock of productive capacities and know-how. The more diverse the export basket, the more diverse the capacities and know-how agglomeration. Hidalgo and Hausmann (2009) first introduced the idea that this may be crucial to a better understanding of the differences in productivity across places. As productive capacities are not always tradable, the differences in pro ductivities and incomes can be explained by differences in places ’ Eco nomic Complexity Index (ECI), a measure of knowledge agglomeration that mirrors the diversity and uniqueness of the productive capacities of a place.
The results in Table 2 provide the essential insight motivating our research. Once we consider all individual factors (schooling, experience, gender, indigenous origins), plus one place-specific characteristic (rural environment), we can only account for 30.0 out of the 61.3 percentage points wage gap.
4. Place-specific determinants of poverty: The usual suspects
The calculation of ECI requires assessing the products that a place produces and those it does not. To turn production into a binary vari able, Hidalgo and Hausmann use Balassa ’ s Revealed Competitive The results reported in the previous section indicate that individual factors account for less than half of the wage gap between Chiapas and the rest of Mexico. In this section, we explore the role of factors asso ciated with characteristics of the place. Credit markets and infrastruc ture are two usual suspects when explaining differences in income across places. None of them seems to play a significant role in explaining why Chiapas is poor.
18 We have derived real interest rates by firm size based on data from Comision Nacional Bancaria y de Valores (interest rates) and INEGI (inflation by federal entity).
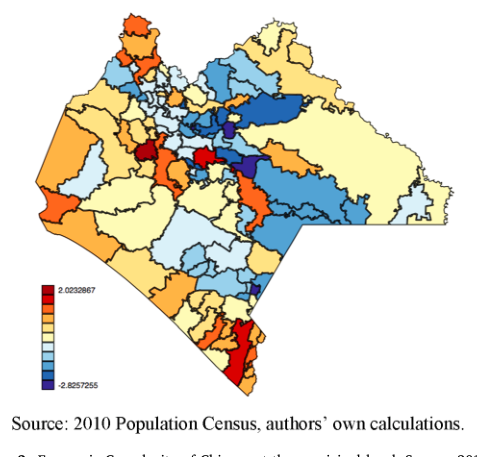
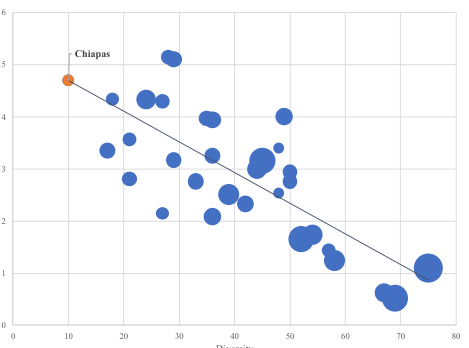
Fig. 2. Diversity and Ubiquity for Mexican States (2010) Source: Authors cal culations based on 2010 population census.
Fig. 3. Economic Complexity of Chiapas at the municipal level. Source: 2010 Population Census, authors ’ own calculations.
Advantage (RCA). 19 According to this measure, a country or place c has a comparative advantage (RCA > 1) in the manufacturing of product i in any given year, when the importance of that good within its export basket is higher than that of the same good in the world ́ s export basket. The measure is calculated as follows:
places (high ubiquity). Fig. 2 displays the diversity and average ubiquity of the products exported with comparative advantage (RCA > 1) at the state level in Mexico. Each dot in the figure corresponds to a Mexican state — Chiapas is highlighted in orange — and the size of the bubble is a function of the average wages in the state. We can confirm the inverse relationship between diversity and average ubiquity at the state level in Mexico and visualize that places with higher diversity and lower ubiq uity have higher wages (as represented by the size of the bubble) than those with lower diversity and higher ubiquity.
(1)
To use this metric at the sub-national level, where no information is available on sales to other geographical units that would effectively constitute “ exports ” from a sub-national standpoint, we rely on a defi nition of RCA based on employment. This choice implicitly assumes that products and services use similar technologies across places in Mexico, and require the same proportions of labor, capital, and know-how in every place. The benefits of this method are two-fold. First, it allows to account for differences in the relative strength of industries across mu nicipalities. Second, it allows to incorporate the service sector — tradable and non-tradable, which is absent in the Hidalgo-Hausmann framework (2009) due to the lack of standardized international statistics on service exports. Therefore, we interpret higher relative employment within the context of equation (1) as a signal of industry strength in the place.
As expected, there is a negative relation between average ubiquity (Y axis) and the diversity of products and services in each state (X axis). In addition, Chiapas has the lowest diversity, and has relative comparative advantages (RCA > 1) in products and services that are highly ubiqui tous. At the other end of the spectrum, Distrito Federal, Nuevo Le ́ on and Jalisco produce a large number of goods and services that are, on average, the least ubiquitous.
Now that we have a binary way to assess if a certain good or service is produced in a location with relative comparative advantage, we define M cp as a matrix containing 1 if the place produces good p with RCA > 1, and 0 otherwise. The diversity and ubiquity result from adding rows and columns (respectively) of that matrix.
We define two place-specific parameters, depending on whether each place is able to produce and manufacture with positive RCA. One is diversity : the number of products and services a place is able to produce with RCA > 1; the other is ubiquity, calculated as the number of places that, on average, are able to manufacture those products and services with RCA > 1. Empirically, there is an inverse relationship between ubiquity and diversity prevailing at both the national (comparing ex ports across countries 20 ) and sub-national level (comparing production across states, metropolitan areas, or municipalities within countries 21 ). Places with a larger variety of productive capacities can manufacture a more diverse array of products, which are, on average, produced in fewer places. In contrast, places that have some productive capacities and little know-how, will not only be able to manufacture a relatively low number of goods (low variety), but also goods produced in many More formally, let us define,

Diversity = k c , 0 = M cp

Ubiquity = k p , 0 = M cp To generate an indicator of the capacities and know-how accumu lated in a place or required to manufacture a certain product, we need to use the information contained in the ubiquity of a product to correct for the content embedded in diversity. For places, we need to calculate the average ubiquity of its basket of goods and services, and the average diversity of the places that produce those same goods, and so on. For products, we need to calculate the average diversity of places that manufacture those products and the average ubiquity of the other products those places make. This iterative process introduces important corrections in the estimation of the stock of know-how agglomerated in a place, such as disregarding natural resources as complex goods, just 19 See Balassa (1964) . 20 See Hausmann et al. (2014) , pp. 21 See Hausmann, Morales, and Santos (2016) for an analysis on Panama provinces, or Reynolds et al. (2018) for the case of states in Australia.
Table 3 Regression of total annualized change in real income per worker by municipality (2000 – 2010) and ECI, controlling for initial level of income and share of natural resources in exports.
t-statistics in parentheses. *** p < 0.01, ** p < 0.05, * p < 0.1.
Table 4 Regression of total annualized change in employment per municipality (2000 – 2010) and ECI, controlling for initial level of income and share of natural resources in exports.
t-statistics in parentheses. *** p < 0.01, ** p < 0.05, * p < 0.1.
because very few places have RCA > 1 on them. The correction comes by factoring in the diversity of the basket of goods and services of places that are intensive in natural resources, which typically, is not very diverse. We can express the iteration between ubiquity and diversity described above in a recursive form as follows:
Note that (6) is only satisfied when k c , N = k c , N − 2 = 1 . This is the eigenvector of M cc ’ associated with the higher eigenvalue . Given that this eigenvector is a vector of 1, it is not informative. Instead, we will search for the eigenvector associated with the second higher eigenvalue . That eigenvector captures the highest quantity of information in the system, and therefore, it will be our measure of economic complexity. 22

k c , N = 1 Therefore, we define our ECI as follows:
ECI = eigenvector associated with the second highest eigenvalue of M cc ’

(8)
k p , N = 1 We have calculated employment-based ECI for all municipalities in Mexico. Fig. 3 reports the results for the 122 municipalities within Chiapas.
Inserting (2) in (1) we obtain,

k c , N = 1 We can observe a significant heterogeneity in the degree of knowl edge agglomeration across different places within the state. This is a promising feature, as the explanation to why Chiapas is poorer than the rest of Mexico should also account for the large income differences observed within Chiapas. Before we move on to test this, we first need to prove that ECI is indeed informative in forecasting future growth rates and estimating growth rates at the municipal level in Mexico.
M cp

(5)
This in turn can be written as,

where 22 Hidalgo and Hausmann (2009) introduced the Economic Complexity index using an iterative calculation, while Hidalgo (2011) shows that the system converges and its solution is the second eigenvector. Both solutions are equivalent.

(7)
M cc ’ =
as a measure of the knowledge embedded in the economy, in forecasting future growth. Hausmann et al. (2014) used a country ’ s initial ECI as a predictor of growth rates over the next decade, controlling for the initial level of income and for exports of natural resources. We have replicated their procedure at the municipal level in Mexico, with several important adjustments.
Table 5 Oaxaca-Blinder decomposition using the Economic Complexity Index: Factors associated with differences in the mean of income per worker, Chiapas vs. Rest of Mexico.
First, instead of using changes in gross domestic product on the left- hand side of the regression, we use changes in real wages and employ ment at the municipal level between 2000 and 2010. 23 By running two different set of regressions — one using the change in real wages over a decade and another using the change in employment — we can test if the initial ECI is associated with subsequent changes in the productivity of labor (as reflected in wages), or to changes in the quantity of workers (employment). Second, we use our employment-based ECI for the 2443 municipalities existing in Mexico by 2000. As mentioned above, this feature allows us to incorporate all industry codes, goods and services alike. We have also included an interaction term, to allow for the pos sibility that the impacts of ECI in future growth rates vary depending on the initial level of income. At last, as in Hausmann et al. (2014) , we have controlled for the relevance of natural resources at the municipal level, as the ECI does not explain these. To do this, in our regressions, we have controlled for the initial (2000) share of natural resources in exports at the municipal level, as reported by the Mexican Atlas of Economic Complexity. 24 Tables 3 and 4 report our results on changes in real wages and levels of employment, respectively.
The inclusion of ECI into specifications 3, 4, and 5 of both tables increases the explanatory power of these regressions in a range that goes from 15.4 to 20.2 percentage points for wages, and 7.7 – 9.1 in the case of employment changes. The coefficient of the ECI variable is statistically significant in all cases, and the size of the estimated effects is large. On the wage equations ( Table 3 ), an increase of one standard deviation in ECI is associated with the acceleration in wage growth in the range of 3.1% (specification 3) to 4.0% (specifications 4 and 5) per year, which is equivalent to 35.7% or 48.0% in a decade. On the employment 0.70
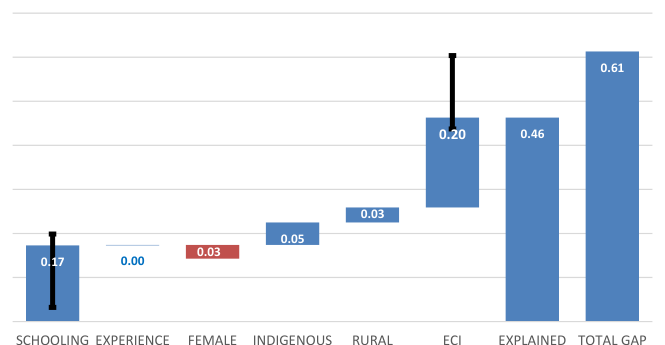
0.60 0.50 0.40 0.30 0.20 0.10 0.00 SCHOOLING EXPERIENCE FEMALE INDIGENOUS RURAL ECI EXPLAINED VARIATION TOTAL GAP Fig. 4. Oaxaca-Decomposition: Bounds for Education and Economic Complexity.
6. ECI as a predictor of growth at the municipal level in Mexico
23 We have also run our specification for the decade 1990 – 2000, and pooling together both decades with year fixed effects, without any relevant changes in the significance or size of the coefficients. The results are available from the authors upon request.
We are interested in testing if the ECI at the sub-national level is not merely positively associated with income, but rather if it is informative,
equations, an increase in one standard deviation in ECI is associated with the acceleration in the rate of growth in total employment, ranging from 1.0% (specification 3) to 2.5% per year (specification 4). This represents acceleration in employment creation of 10.5% and 28.0% in a decade, respectively.
Chiapas and the rest of Mexico, and an upper limit to the contribution of ECI. Fig. 4 depicts the results. 25 While the component of the income gap associated with educational attainment goes from 3.2 to 19.9 percentage points, the component associated with ECI ranges from 17.8 to 34.5 percentage points.
The wide ranges registered indicate a significant correlation between education attainment and ECI. They also suggest that the upper limit for the fraction of the gap that is explained by the former (17.0 percentage points) is significantly lower than that of economic complexity (20.0).
Other coefficients that are significant and have the expected signs within the wage specification are the initial real wages and the initial share of natural resources. On the former, richer municipalities are ex pected to grow at a lower rate, suggesting that municipalities in Mex ico — when considered as a whole — are converging. On natural resources, given that the decade (2000 – 2010) witnessed a sustained boom in the prices of natural resources, it is not surprising to find that, at the municipal level, the higher the share of natural resources in exports at the outset, the higher the growth rate. Interestingly, we do not observe these results in the employment equation, where the effects of convergence disappear, once we include ECI.
8. Conclusions
In this study, we present an original piece of evidence in favor of place-specific explanations of income gaps. Individual characteristics are only relevant to the extent that place-specific conditions are also favorable. In particular, a productive ecosystem where it is possible to combine individual characteristics with other productive and dynamic capabilities is indispensable. Infrastructure and credit markets are certainly part of the conditions for modern production, but they are not the only ones. This study represents an original contribution to the literature, as it builds on a dynamic capability theory of economic growth and tests its validity by estimating an indicator of economic complexity — a proxy for the degree of knowledge agglomeration at the municipal level — and assessing its contribution to the explanation of wage gaps.
Overall, the impacts of ECI on wage and employment growth are significant and sizable, considering they go beyond expectation, in terms of Mexico ’ s growth trends and the mineral wealth of municipalities.
7. Place-specific determinants of the income gap: Economic complexity
We have established that ECI is informative in predicting wage and employment growth at the municipal level in Mexico. We can now test if ECI can increase our understanding of the wage gap puzzle posed in Section two, and in particular, if it increases the explanatory power of the Oaxaca-Blinder decomposition presented in Table 2 . To do this, we run the decomposition again, this time including the ECI of the worker ’ s municipality. We report the results in Table 5 . Notably, there are two significant differences. First, Economic Complexity explains a very large share of the income gap, which is now higher than that of education (20.4 vs. 17.3), and much larger than all other factors. Second, the total explained variation goes from 49% (30.0 out of 61.3 percentage points) in Table 2 to 71% (43.3 out of 61.3 percentage points).
With novel evidence, this study shows that Chiapas is not poor because its workers lack education or experience, are of indigenous origin, or live predominantly in rural areas. All of these factors have a role; however, the most important factor is the lack of a productive ecosystem with modern means of production, where workers can learn, combine their capacities with those of others and acquire new ones, and where firms develop dynamic capabilities.
In the case of Chiapas, modern production systems never made it in the state. Therefore, it remains locked in a capability trap, producing goods and services of little complexity that demand little know-how. The lack of complexity itself acts as a disincentive to acquire further capa bilities, as no one wants to invest in developing skills for an industry that does not exist, and as long as those skills are missing the industry is unlikely to develop. Within such a context, children ’ s education is not considered an investment to gain better incomes in the future, but rather an immediate reduction in the household ’ s productive capacity ( Pelaez- Herreros, 2012 ). The state of Chiapas seems trapped in this chicken-and- egg dilemma. Unless these coordination failures are solved, it makes little sense to continue investing in improving education as a means to increase productivity, as workers from Chiapas will not have a modern ecosystem to deploy those skills and earn higher wages.
As we are interested in discriminating the contribution of individual factors from place-specific factors in explaining income gaps, it is essential to deal with potential endogeneity between economic complexity and educational attainment. The endogeneity goes in both directions, with lower years of schooling potentially constraining eco nomic complexity, and lower economic complexity providing fewer incentives to invest in education. While we cannot solve this problem statistically, we use a process that can help in identifying upper and lower ranges for the impact of each variable.
The process has two steps. First, we run a regression between the ECI of the municipality where the individual works and their education level. We then use the residuals of the regression in the Oaxaca-Blinder decomposition as the exogenous component of complexity, cleaned from all its correlation with educational attainment. Thus, we attribute to education all the correlation between ECI and education. In doing so, we obtain a lower bound for the share of wage differences between Chiapas and the rest of Mexico associated with ECI, and an upper bound to the proportion of the gap associated with educational attainment.
Policy makers can play a key role in resolving this capability and growth dilemma. Strategies explicitly targeting coordination failures at the local level are especially relevant to release such constraints. Suc cessful examples include cluster development policies, which have proven useful in many Latin American countries ( Casaburi, Maffioli, & Pietrobelli, 2014, Maffioli, Pietrobelli, & Stucchi, 2016 ), as well as market system development approaches targeting value chains and their enabling environment ( Crespi, Fern ́ andez-Arias, & Stein, 2014, Pie trobelli & Staritz, 2017 ).
We then proceed the other way around, running a similar regression by placing education on the left-hand side and ECI as the regressor, and input the residuals in the Oaxaca-Blinder decomposition as the exoge nous component of educational attainment. In this second step, we attribute to ECI all of the existing correlation between complexity and educational attainment. Thus, we obtain a lower bound for the contri bution of education attainment to explaining income gaps between In sum, this study argues that place-specific factors tend to be more relevant than individual ones when it comes to explaining income gaps, and that sorting out the coordination failures that are hindering know- how agglomeration is necessary to induce firms to invest in dynamic capabilities and to increase economic complexity.
Appendix 1. Summary statistics Standard deviations in parenthesis References Ricardo Hausmann is Director of Harvard ’ s Growth Lab Program, at the Center for In ternational Development, and Professor of the Practice of Economic Development at Harvard Kennedy School. Previously, he served as the first Chief Economist of the Inter- American Development Bank (1994-2000), where he created the Research Department. He has served as Minister of Planning of Venezuela (1992-1993) and as a member of the Board of the Central Bank of Venezuela. He also served as Chair of the IMF-World Bank Development Committee. Hausmann was Professor of Economics at the Instituto de Estudios Superiores de Administracion (IESA) (1985 – 1991) in Caracas, where he founded the Center for Public Policy. His research interests include issues of growth, macroeco nomic stability, international finance, and the social dimensions of development. He holds a PhD in economics from Cornell University.
Carlo Pietrobelli is a professor and policy advisor on innovation and industrial devel opment and policy. He is currently Head of Department and Professor of Economics at University Roma Tre, Italy, Professorial Fellow at UNU-MERIT, Maastricht, and Adjunct Professor at Georgetown University, Washington D.C. During 2009-2016 he was a Lead Economist at the Inter-American Development Bank, where he led the preparation of development loans in Latin America and the Caribbean on innovation and industrial policies, and on cluster and value chains programs, small and medium-sized enterprises and local economic development. His research interests range from development eco nomics to innovation, trade and industry in developing countries. He has published widely in international journals and his last books were published by Harvard University Press, Edward Elgar, Palgrave and Routledge. His latest books are on The Impact Evaluation of Cluster Development Programs: Methods and Practices (IDB, 2016, https://publications. iadb.org/handle/11319/7605 ), and on Firm Innovation and Productivity in Latin Amer ica and the Caribbean: The Engine of Economic Development (Palgrave, 2016). He was Deputy Rector for promoting links between the University and the private sector and Head of Industrial Liaison Office of the University Roma Tre. He holds a PhD in Economics from Oxford University and has been a regular policy advisor to governments in Africa, Asia, Europe and Latin America.